Fig. 10.

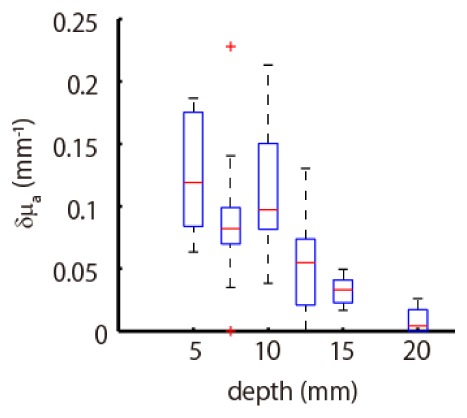
Boxplot of estimated peak values of absorption change as a function of depth at which the absorption change was located.

Boxplot of estimated peak values of absorption change as a function of depth at which the absorption change was located.