
Fig. 12.
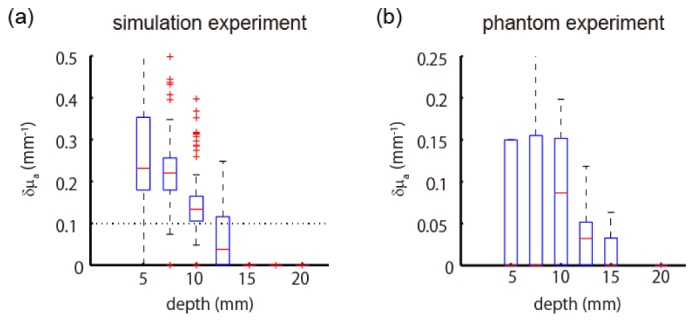
Boxplot of estimated peak values of absorption change as a function of depth at which the absorption change was located. Estimations were based on single-directional measurement of simulation experiment (a) and phantom experiment (b).
Official websites use .gov
A
.gov website belongs to an official
government organization in the United States.
Secure .gov websites use HTTPS
A lock (
) or https:// means you've safely
connected to the .gov website. Share sensitive
information only on official, secure websites.
Boxplot of estimated peak values of absorption change as a function of depth at which the absorption change was located. Estimations were based on single-directional measurement of simulation experiment (a) and phantom experiment (b).