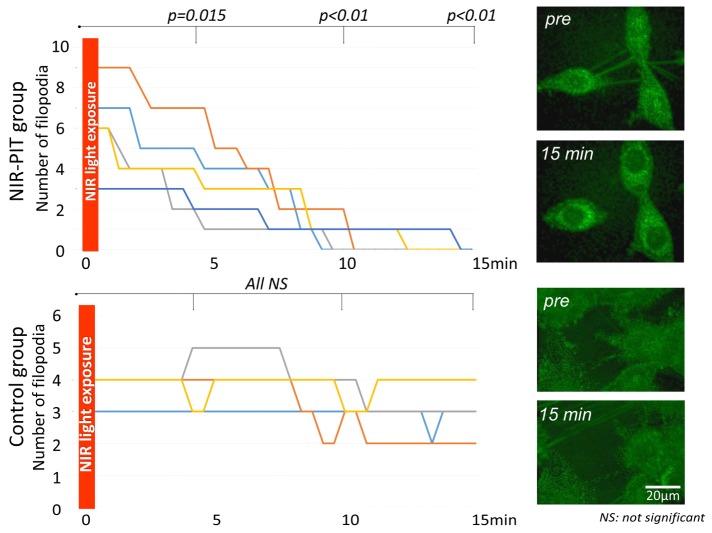
Fig. 2.
Change in number of filopodia on 3T3/HER2 cells after NIR light exposure. In the NIR-PIT group the number of filopodia decreased after NIR light exposure reaching significance at all time points (p = 0.015 at 5 min, <0.01 at 10 and 15 min after NIR-light exposure) (see Visualization 1 (740.9KB, AVI) ). On the other hand, in the control group the number of filopodia was unchanged (see Visualization 2 (1.5MB, AVI) ).

