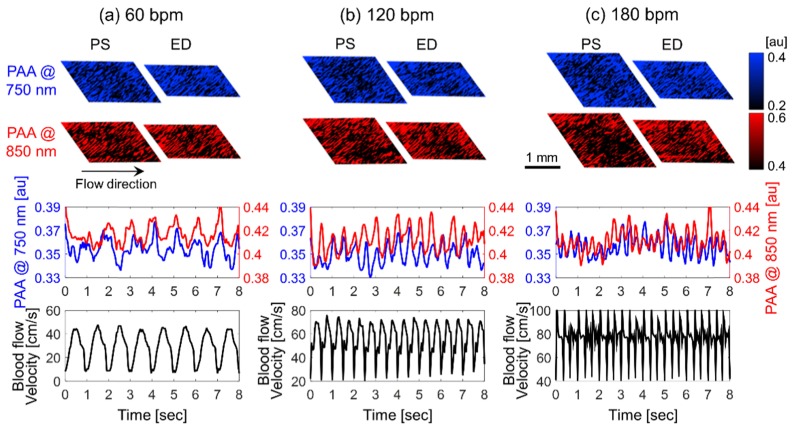
Fig. 2.
Representative images of the photoacoustic amplitude (PAA) at the peak-systolic luminal expansion (PS) and the end-diastolic luminal contraction (ED) (top row). Cyclic variation in the photoacoustic amplitude (PAA) at 750 (blue line) and 850 (red line) nm (center row) and the mean blood flow velocity (bottom row). The left, center and right columns represent 60 (a), 120 (b) and 180 (c) bpm.

