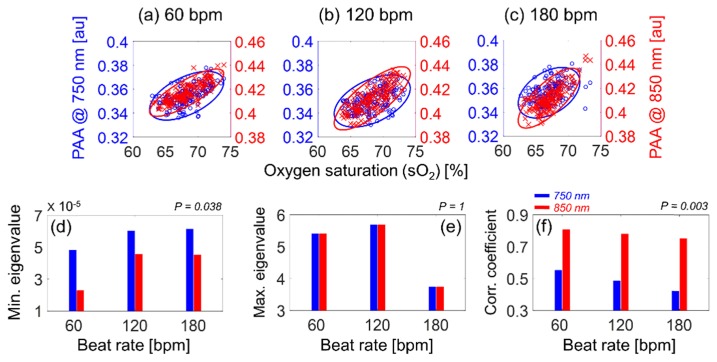
Fig. 7.
Correlation between the PAA (at 750 nm as blue circles and at 850 nm as red x symbols) and the oxygen saturation at 60 (a), 120 (b), 180 (c) bpm. A 95% confidence ellipse was plotted for each case. The minimum (d) and maximum (e) eigenvalues and the correlation coefficient (f) at 750 (blue bar) and 850 (red bar) nm for all beat rates.

