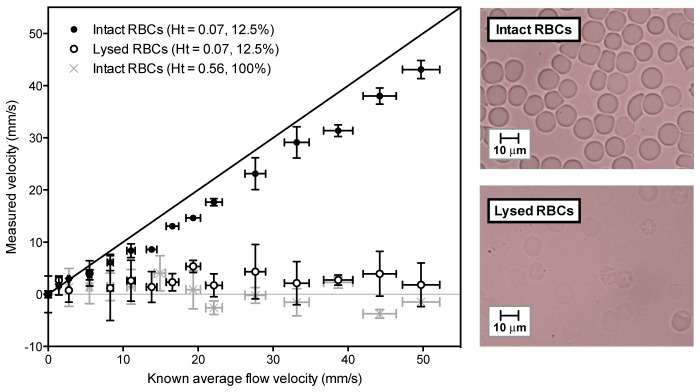
Fig. 6.
The effect of high red blood cell (RBC) concentration and RBC lysis on the accuracy of the time correlation velocity measurement. Velocity measurements were made for whole blood at a normal physiological haematocrit (grey crosses), a suspension of intact red blood cells (12.5% of a normal physiological haematocrit) in phosphate buffered saline (filled data points) and for haemolysed red blood cells (also 12.5%) in distilled water (unfilled data points). In each case, the fluid was flowing through a 400 µm tube, and the measurements were acquired using 540 nm laser pulses separated by T = 0.5 ms and the 30 MHz focussed transducer (θ = 45°). The length of the range gate was set such that it was greater than the tube diameter so the velocity measurement is integrated over the tube cross section. Each data point is the mean of three measurements, with a zero offset correction applied, and the vertical error bars represent the standard deviation. Microscopy images of the red blood cells are shown on the right.

