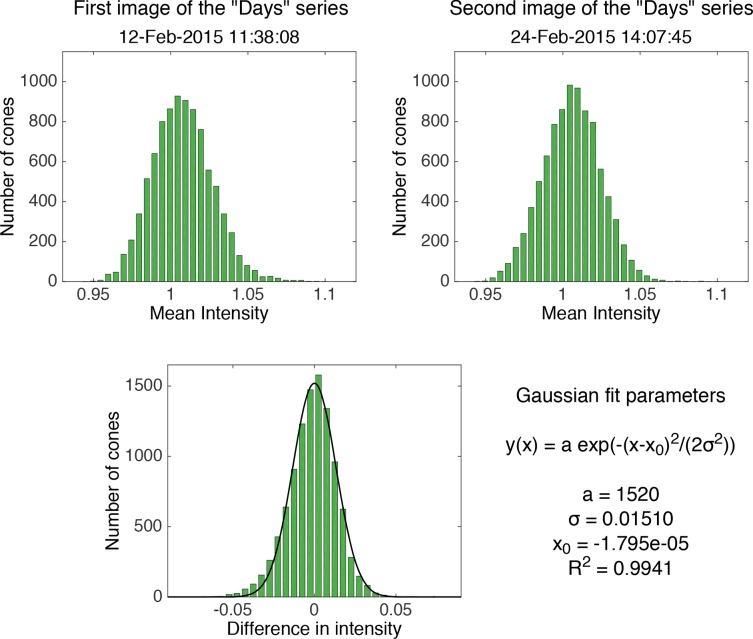
Fig. 6.
Top row: histograms of the cone intensity in the first and second image of the “Days” series at 2.5 degrees. Bottom: histogram of the difference between the intensity of the cones in the second and the first image fitted with a Gaussian distribution, for which the parameters are shown on the right. These histograms are shown as representative of the results on all the images.

