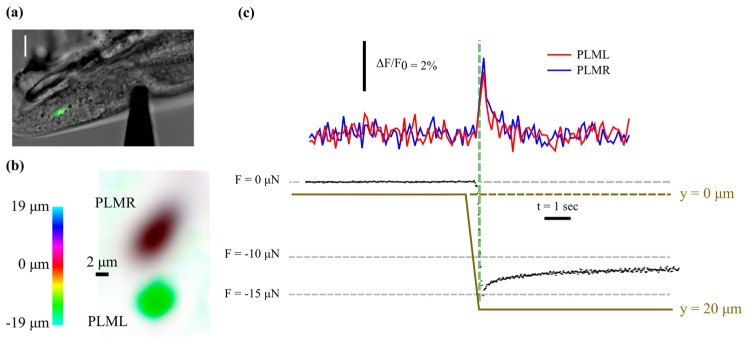
Fig. 5.
(a) DIC image showing indentation of C.elegans specimen using microforce sensing probe with conventional epifluorescence image of PLMR overlaid in green. Due to the shallow depth of field the PLML is not visible. Scale bar is 10 µm. (b) Colour coded depth projection created from the reconstructed focal series showing the cell bodies of the two posterior TRNs. (c) Measured force (black data points), probe position (tan solid line) and average brightness of the two TRNs (top) versus time, indicating that both neurons are activated by the stimulus.

