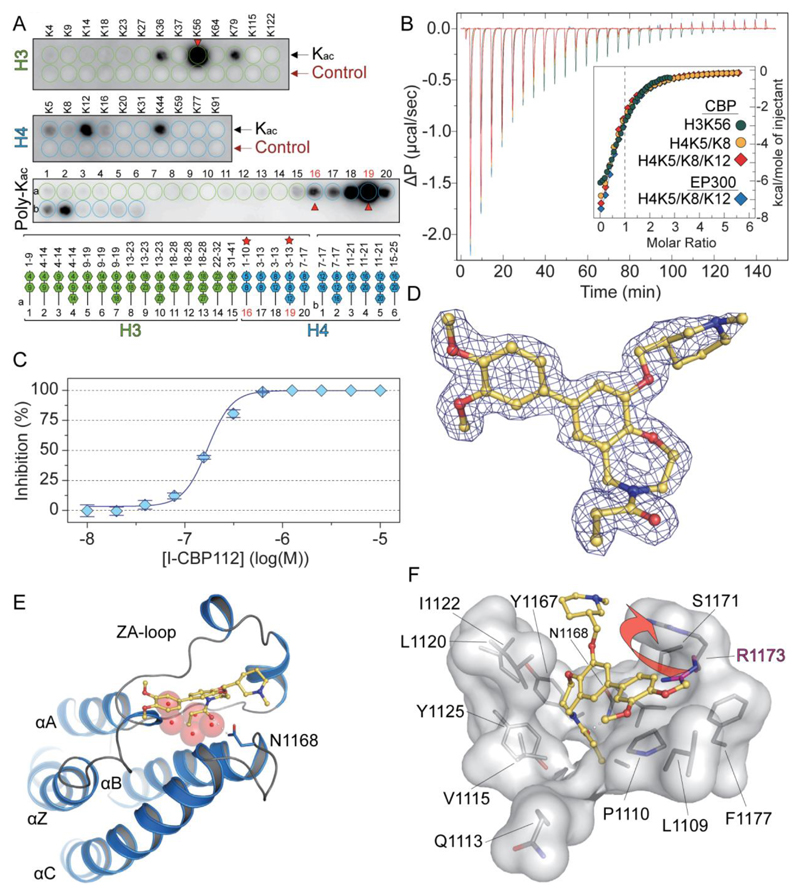
Figure 2. Recognition of acetylated peptide by CBP and structural features of I-CBP112 interaction with the CBP bromodomain.
A: SPOT analysis of the binding of CBP to a library of acetylated histone peptides. The row labelled “control” represents the corresponding non-acetylated peptides. The positions of the poly-acetylation sites are indicated in the lower panel. Peptides used for ITC experiments are highlighted by red stars and arrows on the plot. B: ITC experiments measuring binding affinities of identified mono and poly-acetylated peptides. C: Determination of in vitro IC50 value for the CBP/I-CBP112 interaction using AlphaScreen and the H3K56ac peptide. D: 2FoFc electron density map defining the conformation and binding mode of the I-CBP112 inhibitor in complex with CBP. E: Co-crystal structure of the bromodomain of CBP in complex with I-CBP112. Shown is a structural overview using a ribbon diagram. The main structural elements are labelled. The inhibitor is shown as a stick model. Hydrogen bonds are indicated by dotted lines and water molecules are show as red semi-transparent spheres. F: Details of the I-CBP112 interaction with the CBP bromodomain. The structural changed induced by the binding of the inhibitor involving and outward movement of R1173 is indicated by an arrow.

