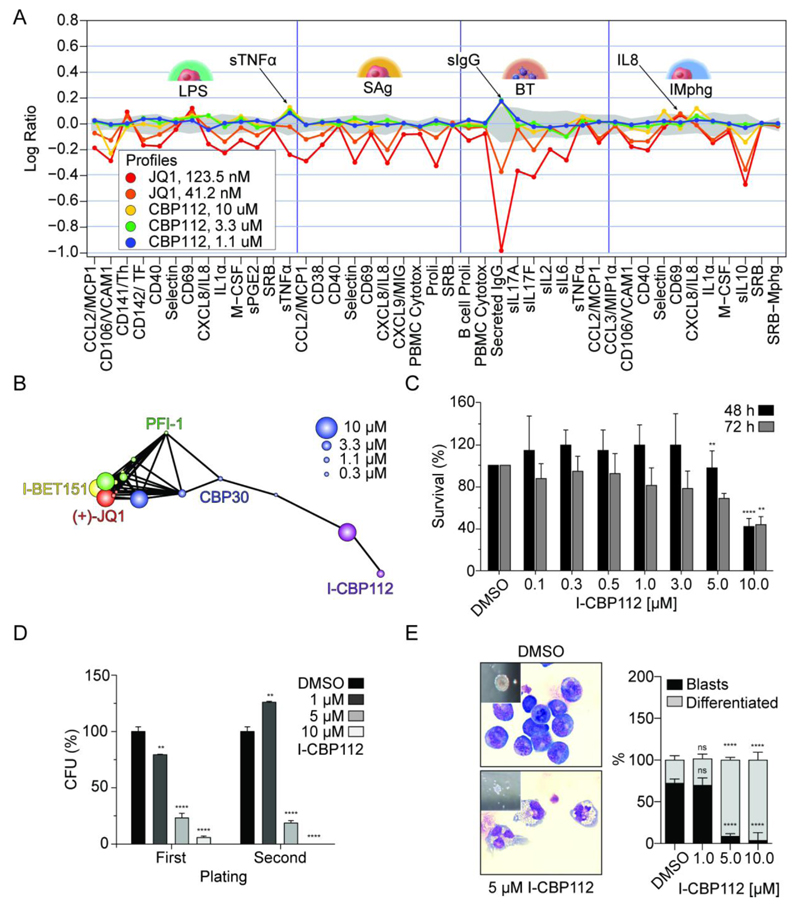
Figure 4. BioMAP data for I-CBP112 and effects on mouse MLL-CBP-immortalized bone marrow cells.
A: BioMAP data of four hematopoietic co-culture systems (Sag and LPS: Peripheral blood mononuclear cells cultured with venular endothelial cells; BT: B-cells and peripheral blood mononuclear cells; IMphg: venular endothelial cells co-cultured with M1 macrophages) treated with JQ1 or I-CBP112. The full BioMAP and explanation of the monitored marker proteins is shown in supplemental figure 2. B: Correlation of the phenotypic response of the panBET inhibitors JQ1, PFI-1, IBET-151, CBP30 and I-CBP112. Responses to compound inhibition above the selected threshold (Pearson ≥ 0.6) are represented by connected dots. C: Cytotoxicity (WST1-assay) of I-CBP112 on murine bone marrow cells immortalized by retroviral expression of the MLL-CBP fusion oncogene. Shown is the mean percentage normalized to vehicle- treated, error bars represent ±SD, P values were calculated by using ANOVA and Dunnett multiple comparison, ** p<0.01 **** p<0.0001, n=4. D: Clonogenic growth and replating assay of mouse MLL-CBP immortalized bone marrow-derived murine progenitors in methylcellulose, treated with I-CBP112. Shown is the mean percentage normalized to vehicle- treated, error bars represent ±SD, P values were calculated by using ANOVA and Dunnett multiple comparison, ** p<0.01 **** p<0.0001, n=2. E: Morphological changes of MLL-CBP immortalized progenitors on cellular and colony level upon exposure to increasing concentrations of CBP112 (left panel). Percentage of blasts and differentiated cells scored on cytospots. Shown is the mean percentage normalized to vehicle- treated, error bars represent ±SD, P values were calculated by using ANOVA and Dunnett multiple comparison, **** p<0.0001, n=20 scored high-magnification (x60) fields (right panel).

