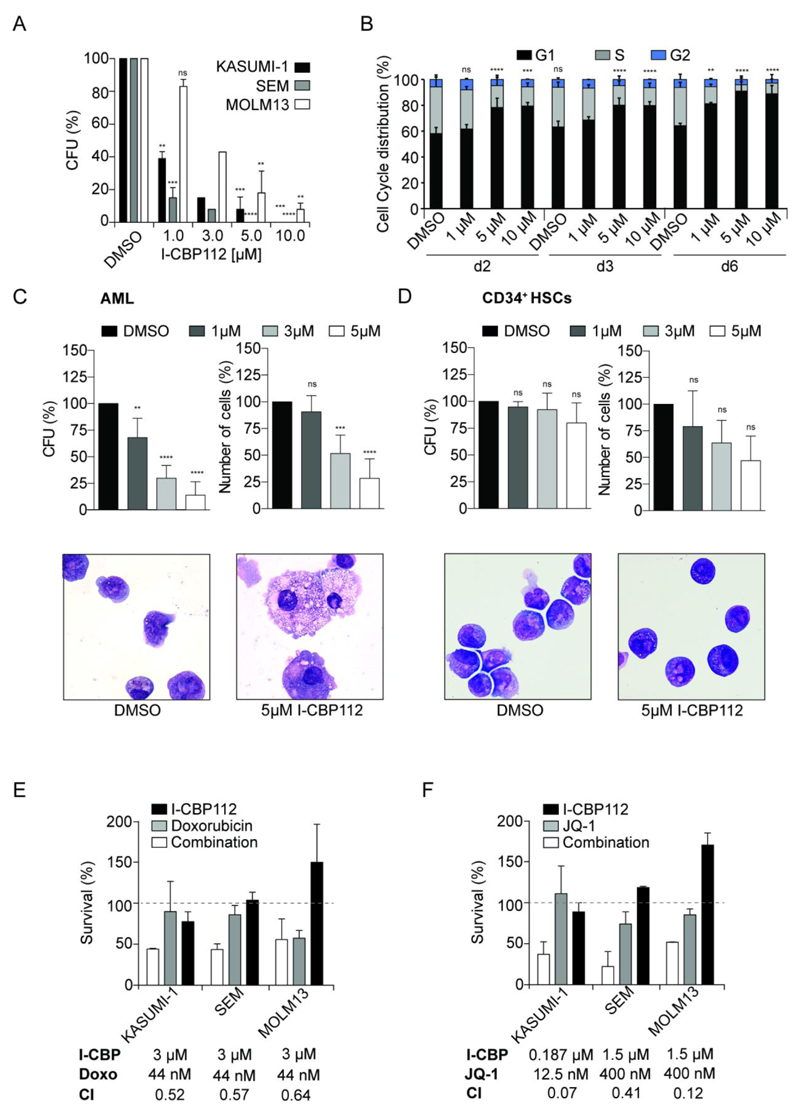
Figure 6. I-CBP112 impairs the clonogenic growth of human leukemic cells and sensitizes them to BET inhibition and doxorubicin.
A: Clonogenic activity of three human leukemic cell lines in methylcellulose, exposed to different doses of I-CBP112. Shown is the mean percentage normalized to vehicle- treated, error bars represent ±SD, P values were calculated by using ANOVA and Dunnett multiple comparison, ** p<0.01 *** p<0.001 **** p<0.0001, n=3. B: Cell cycle phase distribution of KASUMI-1 cells analysed by flow cytometry upon treatment with increasing doses of I-CBP112 at different time points. Medium and compound were renewed after 3 days. Shown is the mean percentage normalized to vehicle- treated, error bars represent ±SD, P values are shown for G1 phases and were calculated by using two-way ANOVA and Turkey multiple comparison, ** p<0.01 *** p<0.001 **** p<0.0001, n=2-4. C: Clonogenic growth and cell numbers of primary blast cells from 5 AML patients. Shown is the mean percentage normalized to vehicle- treated, error bars represent ±SD, P values were calculated by using ANOVA and Dunnett multiple comparison, ** p<0.01 *** p<0.001 **** p<0.0001, n=5. Morphology (Giemsa-Wright stain) of primary blast cells from AML patients treated with DMSO or 5 µM I-CBP112. D: Clonogenic growth and cell numbers of CD34+ cells from healthy donors. Shown is the mean percentage normalized to vehicle- treated, error bars represent ±SD, P values were calculated by using ANOVA and Dunnett multiple comparison, n=3. Morphology (Giemsa-Wright stain) of CD34+ cells from a healthy donor treated with DMSO or 5 µM I-CBP112. E: Synergy study of KASUMI-1, SEM and MOLM13 cells treated either with indicated non-cytotoxic doses of I-CBP112 (black bars), doxorubicin (grey bars) or both compounds (white bars). Concentrations used and combination index (CI) are given in the figure. CI<1 indicates a synergistic effect. F: Synergy study of KASUMI-1, SEM and MOLM13 cells treated either with indicated non-cytotoxic doses of I-CBP112 (black bars), JQ1 (grey bars) or both compounds (white bars). Concentrations used and combination index (CI) are given in the figure. CI<1 indicates a synergistic effect.

