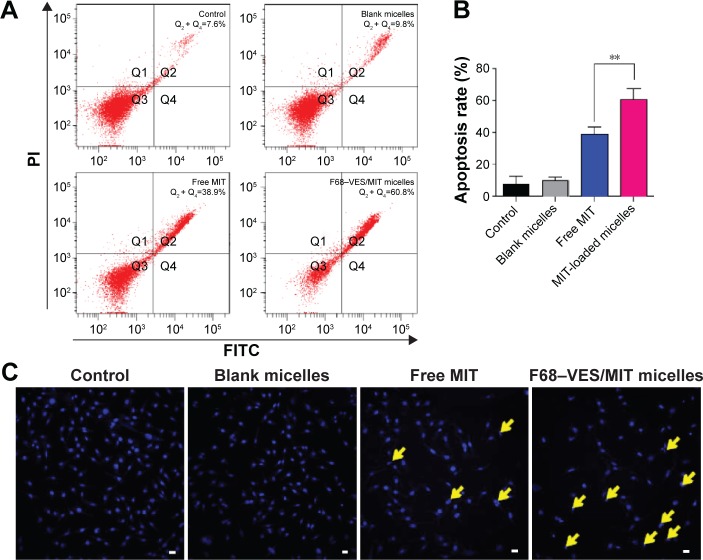
Figure 7.
Apoptotic effect of F68–VES/MIT micelles on MDA-MB-231 cells.
Notes: (A) Cell apoptosis of MDA-MB-231 cells after treatment of different solutions (free MIT and MIT-loaded micelles) for 24 hours at MIT concentration of 2 µM. Q1, Q2, Q3, and Q4 phases correspondingly stand for necrotic cells, late apoptotic cells, live cells, and early apoptotic cells. (B) Apoptotic rates (Q2 + Q4) of cells with or without MIT treatment are presented by bar graph. (C) Nuclear morphology of MDA-MB-231 cells treated with free MIT solution or F68–VES/MIT micelles for 24 hours at MIT concentration of 2 µM. Untreated cells and cells treated with blank micelles served as controls. Cells were stained with Hochest 33342 to visualize nuclear morphology. Apoptotic cells are pointed out with arrows. Error bar represents the standard deviation value of three experiments. The scale bars correspond to 20 µm in all the images. **P<0.01.
Abbreviations: MIT, mitoxantrone; F68–VES/MIT micelles, mitoxantroneloaded Pluronic F68-conjugated vitamin E succinate polymer micelles; h, hours; PI, propidium iodide; FTIR, fourier transform infrared.

