Abstract
Cerebral perfusion x-ray computed tomography (PCT) is an important functional imaging modality for evaluating cerebrovascular diseases and has been widely used in clinics over the past decades. However, due to the protocol of PCT imaging with repeated dynamic sequential scans, the associative radiation dose unavoidably increases as compared with that used in conventional CT examinations. Minimizing the radiation exposure in PCT examination is a major task in the CT field. In this paper, considering the rich similarity redundancy information among enhanced sequential PCT images, we propose a low-dose PCT image restoration model by incorporating the low-rank and sparse matrix characteristic of sequential PCT images. Specifically, the sequential PCT images were first stacked into a matrix (i.e., low-rank matrix), and then a non-convex spectral norm/regularization and a spatio-temporal total variation norm/regularization were then built on the low-rank matrix to describe the low rank and sparsity of the sequential PCT images, respectively. Subsequently, an improved split Bregman method was adopted to minimize the associative objective function with a reasonable convergence rate. Both qualitative and quantitative studies were conducted using a digital phantom and clinical cerebral PCT datasets to evaluate the present method. Experimental results show that the presented method can achieve images with several noticeable advantages over the existing methods in terms of noise reduction and universal quality index. More importantly, the present method can produce more accurate kinetic enhanced details and diagnostic hemodynamic parameter maps.
Keywords: Cerebral perfusion CT, Low-dose, Low-rank, Total variation, Regularization
1. Introduction
Acute stroke is a leading cause of morbidity and mortality worldwide. Cerebral perfusion computed tomography (PCT) is an effective diagnostic tool for evaluating acute ischemic stroke by calculating several perfusion parameters, such as mean transmit time (MTT), cerebral blood volume (CBV), and cerebral blood flow (CBF) [1, 2]. In acute stroke examination with a standard PCT scanning protocol, the dynamic acquisition of sequential CT sections in cine mode should be performed for approximately 1 min [3, 4]. Hence, its associative excessive radiation exposure radiation remarkably exceeds that used in conventional CT examination, which has raised significant concern from patients. Minimizing x-ray exposure in cerebral PCT examinations has been one of the major endeavors in CT fields [5, 6, 7, 8, 9].
To date, various techniques that optimize cerebral PCT scanning protocol for dose reduction has been explored, including low-mAs and/or kVp exposure control [7, 9, 10, 11, 12] or decreasing the image acquisition frequency in enhanced scans [13, 14]. Notably, low-mAs exposure control is a straightforward and cost-effective means to reduce radiation dose in clinic. However, excessive quantum noise in low-mAs projection data acquisition would unavoidably lead to degraded images and hemodynamic parameter maps. To address this ill-posed problem, many approaches have been reported, including projection and image filtering techniques [5, 15, 16, 17], sequential-images iterative reconstruction [6], and parameter maps estimation by an iterative scheme with a strong regularization [18, 19, 20]. For example, Ma et al. presented an iterative image reconstruction method based on maximum a posterior with an pre-contrast scan induced edge-preserving prior [6]. Fang et al. presented a robust low-dose CT perfusion deconvolution method via tensor total-variation regularization [19]. Meanwhile, a major drawback of sequential-image or parameter map iterative reconstruction methods is the computational load caused by multiple re- and back-projection operations in image or parameter map domains. Although most projection filtering techniques can suppress noise and streak artifacts with less computational burden, they usually sacrifice structural details without considering accurate noise modeling over all projections. In addition, noise distribution of low-dose CT images is usually non-stationary and unknown. As a result, it is a difficult task to design an advanced structure preserving image filter in practice. In general, a successful CT image iterative reconstruction approach needs incorporating specific prior information of desired image. A typical example is the sparsity prior of image in a transform domain including the discrete gradient transform and wavelets transform, which has been studied in perfusion CT [14], cone-beam CT [21] and spectral CT [22].
Recently, instead of simple sparsity of vectors, researchers have paid attention to explore the low-rank characteristic of matrices. The related techniques have demonstrated impressive performance in video restoration [23, 24], and medical imaging including four-dimensional CT [25], spectral CT [26], and dynamic magnetic resonance imaging (MRI) [27]. In this paper, with the facts that the rich similarity redundancy information exists among enhanced sequential PCT images, we propose a low-dose PCT image restoration model by incorporating the low-rank and sparse matrix characteristic of sequential PCT images. More specifically, the sequential PCT images were first stacked into a matrix (i.e., low-rank matrix), and then a non-convex spectral norm/regularization and a spatio-temporal total variation (TV) norm/regularization were built on the low-rank matrix to describe the low-rank and sparsity of the sequence PCT images, respectively. An improved split Bregman algorithm was developed to minimize the present objective function. Qualitative and quantitative evaluations were carried out on both the digital phantom and clinical cerebral PCT datasets in terms of several evaluation metrics.
The remaining parts of the paper are organized as follows. Section 2 describes the process of dynamic PCT imaging, the low-rank matrix recovery model, the present PCT image restoration model, and the associative optimization algorithm. The experimental setup and evaluation metrics are also presented in this section. Evaluation results are presented in Section 3. Finally, the discussion and conclusion are given in Sections 4 and 5, respectively.
2. Methods and Materials
2.1. Brief review of dynamic PCT imaging
In clinic, PCT examination of brain regions is performed as follows: first, the pre-contrast unenhanced CT scan of the whole brain is performed. Then, following an intravenous injection of iodinated contrast agent, continuous enhanced dynamic scan of the selected slices of brain in a cine mode is performed. The obtained dynamic measurement can be viewed as a temporal sequence of 2D spatial images. Finally, several nondeconvolution and deconvolution methods [28] can be used to process the obtained sequential PCT images for obtaining quantitative hemodynamic information, such as MTT, CBV, and CBF.
2.2. Overview of the low-rank and sparsity modeling for sequential PCT image restoration
2.2.1. Low-rank matrix recovery
Low-rank matrix recovery is currently a hot topic in image processing which can be regarded as a rank regularized minimization problem [29] from the given observation matrix M corrupted by errors E, i.e.,
| (1) |
where rank(X) represents the rank of the desired objective matrix X; denotes the Frobenious norm; and λ is a hyper-parameter to balance the first (i.e., fidelity term) and the second (i.e., penalty term) terms. Due to the form of rank penalty, directly minimizing the objective function in Eq. (1) is a difficult task. To address this issue, similar to [27], the rank penalty can be relaxed to be a nuclear norm representation with , where σi are the singular values of X. Through this relaxation, the recovery of the low-rank matrix X can be simplified as follows:
| (2) |
Recht et al. has shown that this approach perfectly recovers the matrix X with a high probability, if the random measurement ensemble is used and the number of measurements exceeds a constant times the number of degrees of freedom [29].
2.2.2. LR-TV model for PCT image restoration
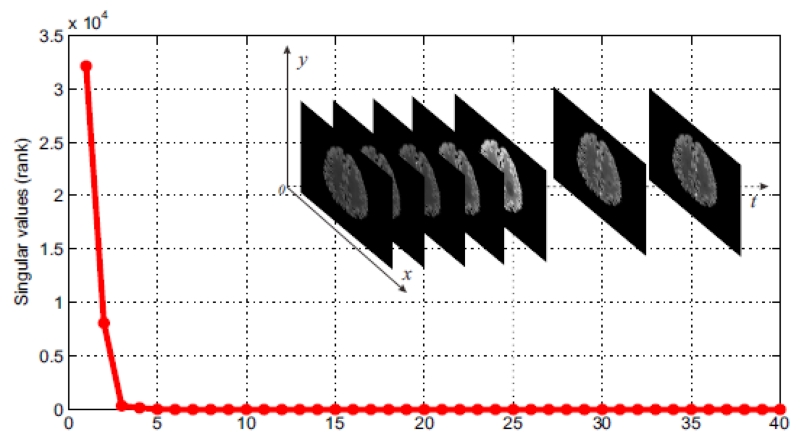
In PCT imaging, rich similarity redundancy information existing among the enhanced sequential PCT images leads to the low-rank matrix characteristic of the stacked sequential images. Specifically, the sequential PCT images can be represented as a matrix that has linearly dependent rows, i.e., low-rank. An illustration of the low-rank characteristic of the sequential PCT images is shown in Fig. 1. Moreover, the sparsity of the sequential PCT images, which corresponds to the enhanced perfusion information, can also be exploited along with the low-rank matrix characteristic to further improve image quality. Hence, we pose the PCT image restoration problem as a regularized matrix recovery problem with low-rank and TV (sparsity) constrains, which is referred to as “LR-TV” for simplicity. Mathematically, the LR-TV model for PCT image restoration can be formulated as:
| (3) |
where M is the noisy PCT sequence, X = [x1, ⋯ , xj, ⋯ , xNt], xj denotes the column vector corresponding to the sorted spatial pixels in the jth frame image Xj with size of Nx × Ny, Nt denotes the number of temporal frames, | · | denotes the absolute value of each element, K1 and K2 are positive integers. Φ0 = Dx, Ψ0 = I, Φ1 = Dy, Ψ1 = I, Φ2 = I, Ψ2 = Dt, , and I is the identity matrix; Dx, Dy, and Dt are finite difference matrices (discrete gradient transforms) along x, y, and t, respectively. Note that and denote the sparsifying transform of the row-space; XDt denotes the sparsifying transform of the column-space.
Figure 1.
Justification of the low-rank characteristic of the sequential PCT images with Nt = 40. It can be seen that the matrix is low-rank because only a few singular values are not close to zero.
To effectively optimize the cost function in (3), we rewrite the above constrained optimization problem using Lagrange’s multipliers method and relaxing the penalties as follows [30]
| (4) |
where λ1 , λ2 > 0 are two regularization parameters. ϕ(X) is the relaxed low-rank regularization with the definition of , which is used to penalize the small singular values associated with serious artifacts. In the implementation, p was set to 0.5 for all the experiments according to [31]. In this paper, the ℓ0 norm is relaxed to be a convex ℓ1 norm representation with , which denotes the spatio-temporal TV norm about the gradient of the entire volume. Compressive sensing theory has guaranteed that an image can be accurately reconstructed from sparse samples of its discrete gradient transform [32].
2.3. Optimization approach
Due to the nonsmooth spectral and TV regularization, Eq. (4) can not be solved directly by the conventional gradient descent methods. In this work, we pose the regularized matrix recovery problem in (4) as a constrained minimization using variable splitting technique [33]
| (5) |
where E and Si (i = 0, 1, 2) are auxiliary variables which are also determined during the optimization process.
In this study, we adopt an accurate, efficient, and convergent algorithm for solving (namely the split Bregman method which is essentially equivalent to the augmented Lagrangian method [34]; however it was independently developed from a different perspective to improve the conventional total variation model [33]. Mathematically, it can be well solved sufficiently through the following iterative scheme:
| (6) |
| (7) |
| (8) |
| (9) |
| (10) |
| (11) |
where β1, β2 > 0 are two regularization parameters, L, Vi(i = 0, 1, 2), and Z are auxiliary variables.
2.3.1. Minimization with respect to X
The Eq. (6) corresponds to one iteration step in a typical differentiable quadratic minimization, and the solution can be directly derived from its optimal condition. In implementation, the conventional nonlinear conjugate gradient (NCG) algorithm [35] with a few iterations is used.
2.3.2. Minimization with respect to E
Eq. (7) has a form similar to standard nuclear norm minimization problems. The iterative singular value thresholding (SVT) algorithm [36] for nuclear norm minimization can be generalized to deal with this case with spectral penalty. Thus, Eq. (7) can be exactly solved by
| (12) |
where ui, vi and σi are the singular vectors and values of Xk+1 + Lk respectively [27]. Note that when p = 1 Eq. (12) reduces to the SVT algorithm used for nuclear norm minimization problem.
2.3.3. Minimization with respect to Si
The solution of (8) is given by
| (13) |
2.3.4. Implementation
In summary, the implementation of the present LR-TV method for PCT image restoration can be described as follows:
-
1:
Initialization: X0 = Z0 = E0 = L0 = 0, and , i = 0, 1, 2;
2: Initialization: λ1, λ2, β1, β2, and k:=0;
-
3:
While stop criterion is not met;
-
4:
Obtian Xk+1 from (6) by appling the NCG algorithm;
-
5:
Compute Ek+1 using (12);
-
6:
Compute using (13), i =i0, 1, 2;
-
7:
Lk+1 = Lk + Xk+1 − Ek+1;
-
8:
;
-
9:
Zk+1 = Zk + Xk+1 − M;
-
10:
End if stop criterion is satisfied.
In this study, an initial estimate of the to-be restored image in line 1 was set to be uniform with value of zero. In line 2, four parameters, i.e., λ1, λ2, β1 and β2 are initialized before the iteration. The related parameter selections are discussed in Section 2.4. According to the convergence of the split Bregman algorithm, the sequence generated by the LR-TV algorithm converges to the solution of Eq. (4) when p = 1, but the theoretical guarantees on the convergence are not valid for the nonconvex spectral regularization when p < 1 [33]. The convergence of LR-TV method for nonconvex case is much more difficult to prove, and is considered beyond the scope of this paper. However, our experimental studies to be reported below seem suggesting the convergence of our LR-TV method.
2.4. Parameter selections
2.4.1. Selection of λ1 and λ2
Two penalty parameters λ1 and λ2 control the trade-off between a good fit of M and the present non-convex regularization. In practice, optimizing them is a difficult task in CT image restoration/reconstruction [5, 37, 38]. In the implementation, they are empirically selected by matching the noise level of the processed low-dose PCT images with the corresponding normal-dose ones. In this study, the parameters are recommended according to the previous work in [23]:
| (14) |
where n1 (n2) is the number of rows (columns) of the image matrix X. λ1 as a single parameter in the present method controls the smoothing strength of the restored image and is empirically selected based on the noise level of processed data in our studies.
2.4.2. Selection of the stop criterion
In our studies, to find a stable convergent solution, the stop criterion of the present LR-TV algorithm is designed as || Xk+1 − Xk ||F/|| Xk ||F≤10−6 which has been widely used in the optimization.
2.5. Experimental data acquisitions
A digital brain perfusion phantom and clinical cerebral PCT images were used to evaluate the performance of the present LR-TV method for enhanced PCT image restoration.
2.5.1. Digital brain perfusion phantom
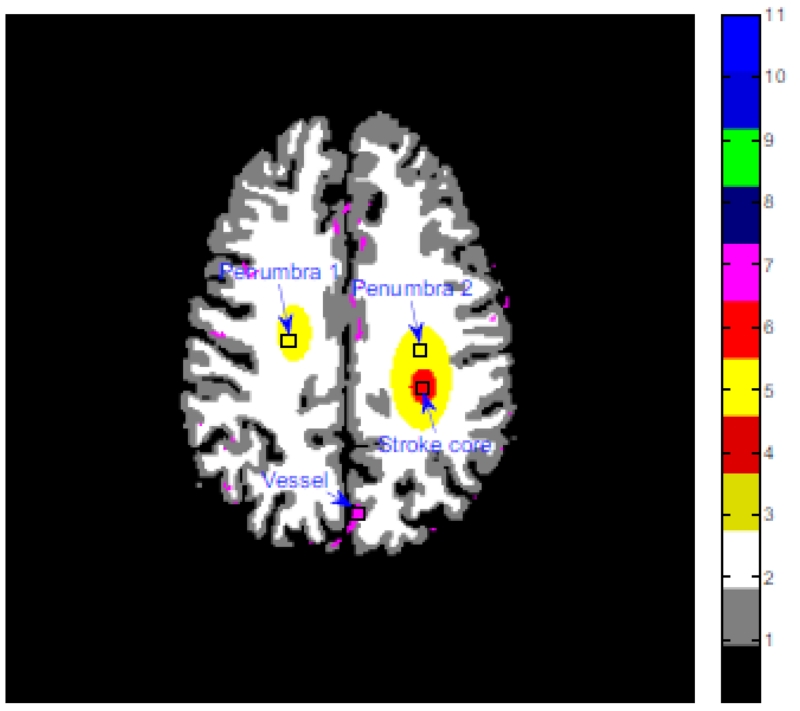
The realistic digital brain phantom (Fig. 2) in [39] was used in this study, which has a complex structure similar to a real human brain. In the simulation, we chose a geometry that was representative for a mono-energetic fan-beam CT scanner setup. The imaging parameters of the CT scanner are as follows: (1) each rotation included 1160 projection views evenly spaced on a circular orbit; (2) the number of channels per view is 672; (3) the distance from the detector arrays to the x-ray source is 1040 mm; and (4) the distance from the rotation center to the x-ray source is 570 mm. All images are composed of 256 × 256 square pixels. Each projection datum along an x-ray through the sectional image was calculated based on the known densities and intersection areas of the ray with the geometric shapes of the objects in the sectional image.
Figure 2.
Digital brain perfusion phantom composed of white matter, gray matter, penumbra artd stroke core.
Similar to previous study in [40], after calculating the noise-free sinogram data , the noisy measurement I was generated according to the statistical model of the pre-logarithm projection data, as follows:
| (15) |
where I0 is the incident x-ray intensity and is the background electronic noise variance. In the simulation, the x-ray exposure level I0 was set to 2.5 × 10⁵ and was set to 10. The noisy sinogram y was calculated by performing the logarithm transformation on transmission data I. Finally, the noisy measurement was reconstructed by the filtered backprojection (FBP) algorithm [41] to obtain the low-dose PCT images.
2.5.2. Clinical cerebral PCT data
The clinical cerebral PCT images of a patient with an old infarction were acquired using a clinical CT scanner without table movement. First, a pre-contrast unenhanced scan of the whole brain was performed with a tube current of 240 mA and tube voltage of 80 kVp. Approximately 50 ml of Iopromide 370 (Ultravist, Schering, Germany) was then injected at a rate of 5.0 ml per second. The continuous enhanced normal-dose scan was performed by the following protocol: 200 mA, 80 kVp, slick thickness 8 mm, 1 s per rotation for duration of 39 s, and reconstruction kernel of H30s. The associate parameters of scanning geometry are as follows: (1) each rotation included 1160 projection views that are evenly spaced on a circular orbit; (2) the number of channels per view is 672; (3) the distance from the detector arrays to the x-ray source is 1040 mm; and (4) the distance from the rotation center to the x-ray source is 570 mm. All the images are composed of 512 × 512 array size.
We simulated the low-dose cerebral perfusion enhanced CT images using the simulation method described in Section 2.5.1 from the acquired normal-dose enhanced images according to the above described CT imaging geometry, rather than scanning the patient twice, to alleviate radiation dose. The CT dose index (CTDIvol) for the normal-dose enhanced scan is 380.80 mGy. The CTDIvol for the simulated low-dose enhanced PCT scan is approximately one-seventh of that of the normal-dose scan.
2.6. Performance evaluation
2.6.1. Noise reduction measure
The relative root mean square error (rRMSE) metric was used to evaluate the noise reduction for quantitative comparison:
| (16) |
where X and Xxtrue represent the matrix composed of the restored and true attenuation coefficients, respectively. A small rRMSE value indicates a small difference value between two matrixes and vice versa.
2.6.2. Time density curve measure
Hemodynamic functional parameters are calculated by measuring the temporal evolution of the concentration of contrast agent at each pixel position in the region of interest (ROI). The associated temporal evaluation can be represented by the time density curve (TDC). To make the evaluation more intuitive, the rough TDC values were directly calculated from the restored sequential PCT images.
2.6.3. Hemodynamic parameter maps measure
The main goal of PCT imaging is to obtain the functional hemodynamic parameter maps, which offers benefits over qualitative assessment of brain blood flow, including the MTT, CBV, and CBF maps.
According to the perfusion model proposed in [42], the temporal signal Cv of the average contrast-agent in a volume element v is obtained by convolving the arterial input function (AIF) Ca with the residue function Rv, i.e.,
| (17) |
where ρv is the brain tissue density in v, CBFv is the regional blood flow in v, and Rv represents the fraction of contrast agent still present in the capillaries in v. The CBFv · Rv is estimated by deconvolving its observation Cv for each voxel v in a volume of interest. In this study, the truncated singular value decomposition (TSVD) [28], was used to quantify the perfusion parameters CBFv in PCT, and we can compute the MTT and CBV using the central volume theorem[43]:
| (18) |
2.6.4. Image similarity measure
To explore the performance of the various methods at the local detail level, the universal quality index (UQI) in [44] was used in (ROI)-based analysis, which was performed by evaluating the similarity between the hemodynamic parameters of estimated images and true phantom. Given a selected ROI at the corresponding locations in the two maps, the mean, variance and covariance of intensities in the ROI can be respectively calculated as follows:
| (19) |
| (20) |
| (21) |
where f(m) denotes the pixel value of the estimated hemodynamic parameter map, fxtrue(m) denotes the pixel value of the ideal hemodynamic parameter map in the ROI, and Q is the total number of voxels in the ROI. The UQI can be calculated as follows:
| (22) |
UQI measures the similarity between two images, and its value ranges from zero to one. A UQI value closer to one suggests great similarity to the ideal hemodynamic parameter map.
2.6.5. Comparison methods
To validate and evaluate the performance of the proposed LR-TV method, spectral and TV regularization were also carried out for comparison and were referred to as the LR and TV methods, respectively. The cost function of LR method (only low-rank regularization with λ2 = 0 in (4)) for PCT image restoration can be written as follows:
| (23) |
where γ1 is a positive parameter used to balance the fidelity (the first term in (23)) and the spectral regularization term. Moreover, the cost function of TV method (only TV regularization with λ1 = 0 in (4)) for PCT image restoration can be expressed as follows:
| (24) |
where γ2 is a positive parameter used to balance the fidelity (the first term in (24)) and the TV regularization term.
3. Results
3.1. Digital brain perfusion phantom study
3.1.1. Convergence analysis
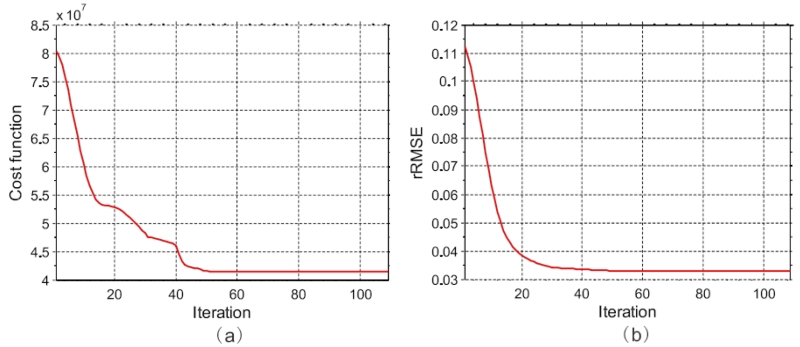
Fig. 3 shows the value of cost function and rRMSE from the present LR-TV method decrease monotonically with respect to the number of iteration. These curves showed that the proposed LR-TV method can converge to a steady solution with enough iteration in terms of value of cost function and rRMSE measure.
Figure 3.
The value of cost function and rRMSE measures from the present LR-TV method with respect to the number of iteration in the study of the digital brain perfusion phantom: (a) the value of cost function versus the number of iteration; and (b) rRMSE versus the number of iteration.
3.1.2. Visualization-based evaluation
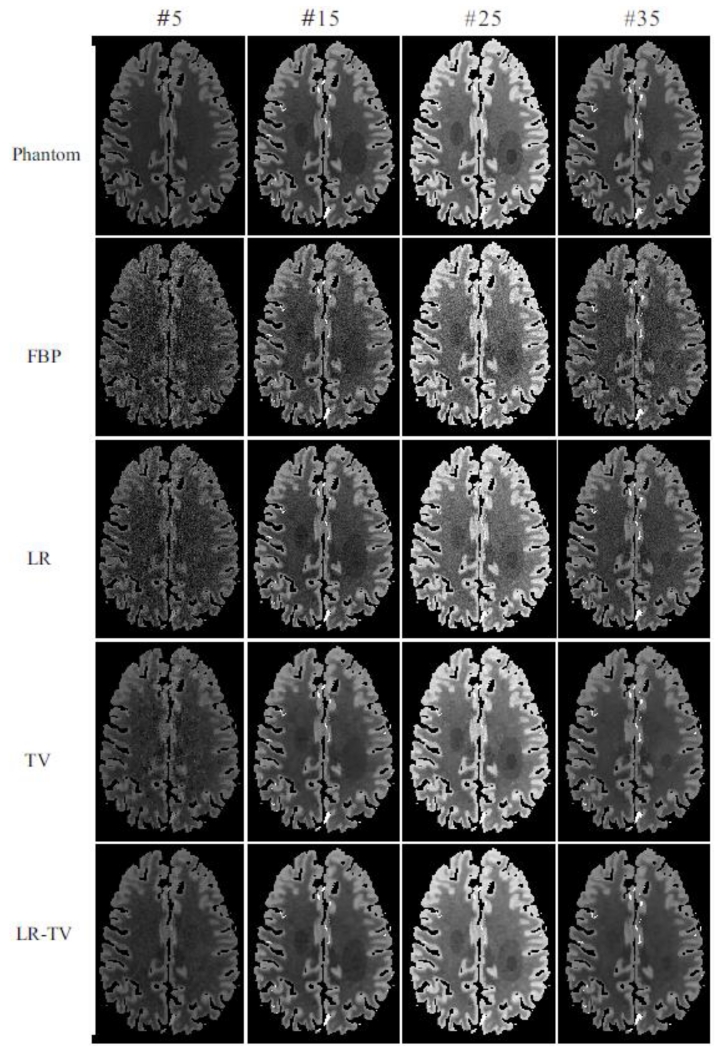
Fig. 4 shows the results restored by four different methods from low-dose PCT data at frame #5, #15, #25, and #35. The first row represents the ground truth; the second row shows the results from the direct FBP reconstruction; the third, fourth, and fifth row show the results from the FBP images restored by the LR, TV, and LR-TV method, respectively. It can be seen that the present LR-TV method can yield remarkable advantages over both the LR and TV methods in terms of noise suppression and structure preservation. Furthermore, we note that LR-TV method outperforms other methods in the area of stroke core and penumbra.
Figure 4.
The ground truth and images restored by different methods at frames #5, #15, #25 and #35.
3.1.3. Noise suppression
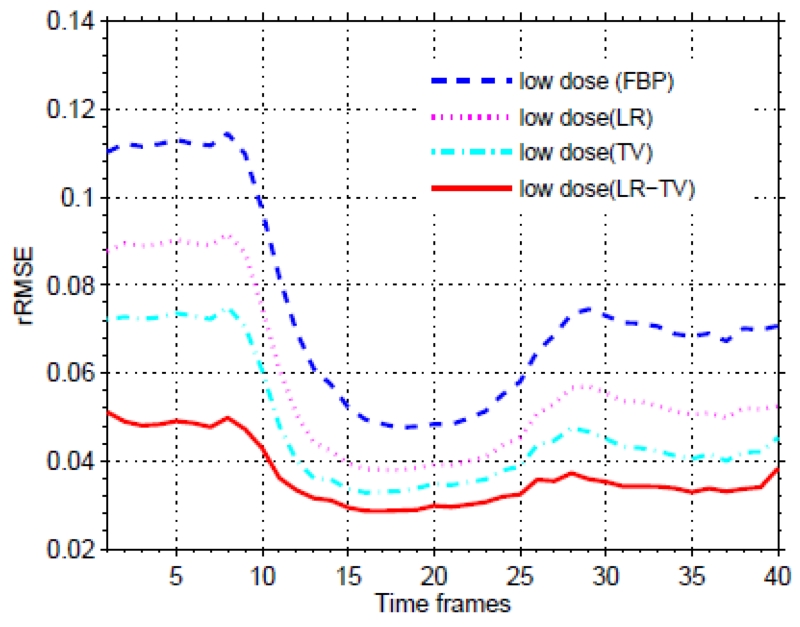
To further quantitatively evaluate the present LR-TV method, the rRMSE was used for measuring noise suppression. Fig. 5 shows the measures of rRMSE from different methods at different frames, respectively. The results demonstrated that the present LR-TV method can achieve noticeable gains over the other methods in terms of noise suppression with quantitative measures.
Figure 5.
The value of the rRMSE measures from the present LR-TV method with respect to the different time frames.
3.1.4. TDC measurement
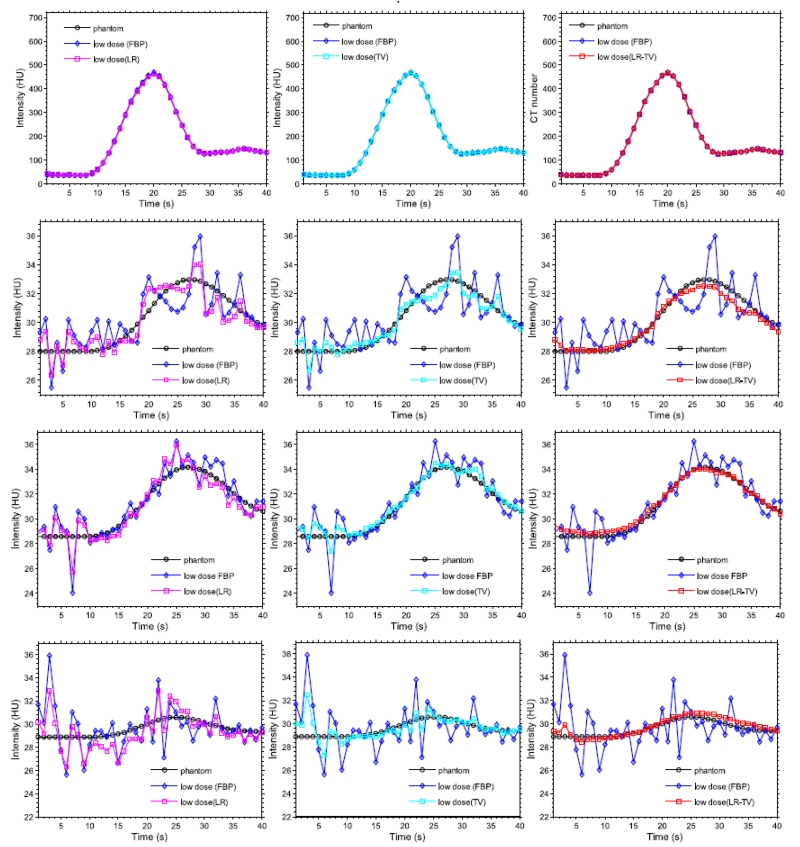
Fig. 6 depicts the TDC accuracy of the vessel, stroke core and penumbra tissue of the dynamic PCT images from the three methods. The TDC values of the large vessel matched well with the ones from the true phantom (Fig. 6(a)) because the contrast agent flow in the enhanced CT value was sufficiently higher than that in the stoke core and penumbra tissue. Meanwhile, the TDC values from the restored images by the LR-TV method for the other regions are closer with the true phantom than those from the images derived from the other methods.
Figure 6.
TDC accuracy of the vessel, stroke core and penumbra tissue of dynamic PCT images: (a) TDC values of the vessel (the 3 × 3 ROI indicated by a ‘vessel’ in Fig. 2; (b) TDC values of the penumbra 1 (the 3 × 3 ROI indicated by a ‘penumbra 1’ in Fig. 2); (c) TDC values of the penumbra 2 (the 3 × 3 ROI indicated by a ‘penumbra 2’ in Fig. 2); and (d) TDC values of the stroke core (the 3 × 3 ROI indicated by a ‘stroke core’ in Fig. 2).
To quantitatively measure the consistency between the TDC values from the true phantom and the simulated low-dose images restored by the LR, TV and LR-TV method, Table 1 lists Lin’s concordance correlation (CC) coefficients [45] of four 3 × 3 ROIs indicated by the blue squares shown in Fig. 2. The results demonstrate that good consistency between the TDCs from the restored low-dose PCT images and the normal-dose PCT images can be found in vessel region with Lin’s CC coefficients higher than 0.999. However, in stroke core, Lin’s CC coefficients from the restored
Table 1.
Lin’s concordance correlation (CC) coefficient between the TDC values from the true phantom and the simulated low-dose images restored by the LR, TV and LR-TV methods. The size of each ROI is 3 × 3 pixels.
| ROIs | Methods | Sample size | Lin’s CC coefficient | 95% confidence interval | p-value |
|---|---|---|---|---|---|
|
|
|||||
| Vessel | LR | 40 | 0.9996 | (0.9994 0.9997) | p < 0.0001 |
| TV | 40 | 0.9998 | (0.9998 0.9999) | p < 0.0001 | |
| LR-TV | 40 | 0.9999 | (0.9979 0.9999) | p < 0.0001 | |
|
| |||||
| Penumbra 1 | LR | 40 | 0.8785 | (0.7823 0.9338) | p < 0.0001 |
| TV | 40 | 0.9571 | (0.9223 0.9765) | p < 0.0001 | |
| LR-TV | 40 | 0.9740 | (0.9590 0.9836) | p < 0.0001 | |
|
| |||||
| Penumbra 2 | LR | 40 | 0.9207 | (0.8585 0.9562) | p < 0.0001 |
| TV | 40 | 0.9773 | (0.9580 0.9878) | p < 0.0001 | |
| LR-TV | 40 | 0.9889 | (0.9824 0.9930) | p < 0.0001 | |
|
| |||||
| Strok core | LR | 40 | 0.3883 | (0.2166 0.5368) | p < 0.0001 |
| TV | 40 | 0.4776 | (0.2274 0.6687) | p < 0.0001 | |
| LR-TV | 40 | 0.8825 | (0.8ω2 0.9288) | p < 0.0001 | |
PCT images by the LR and TV methods are below 0.5 while the corresponding Lin’s CC coefficient from the restored images by the LR-TV method is higher than 0.85, even in cases where all lower bounds of the 95% confidence interval of the CC coefficients are higher than 0.8. In other words, the results indicate a significant agreement between the TDCs from the PCT images restored by the LR-TV method and the normal-dose PCT images.
The results suggest that the LR-TV method can achieve better profiles than the LR and TV methods in terms of the Lin’s CC coefficient measure.
3.1.5. Hemodynamic parameter maps measurement
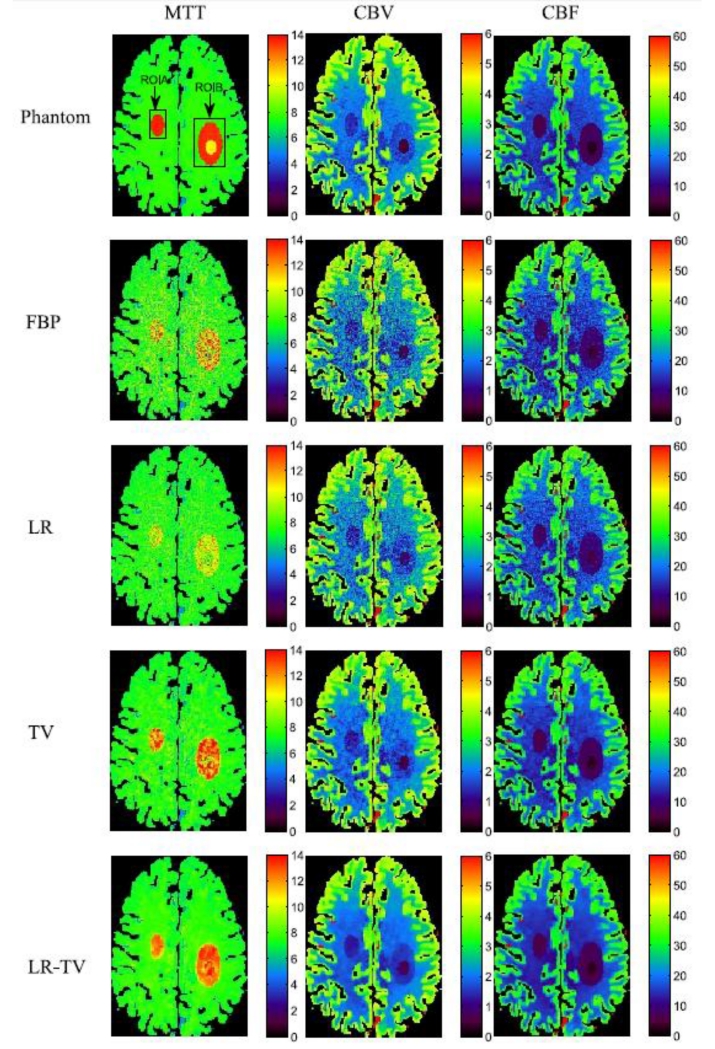
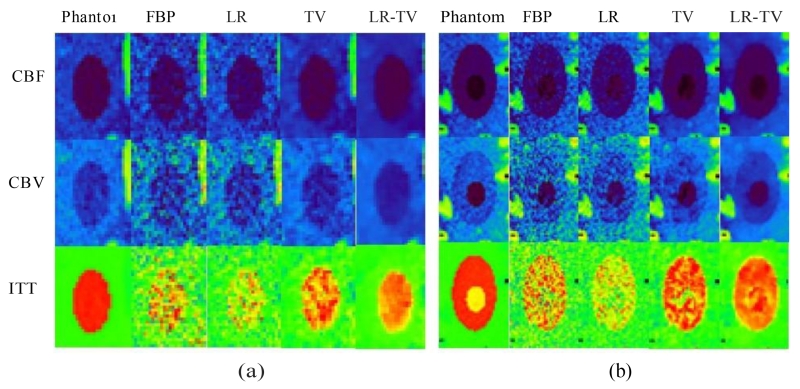
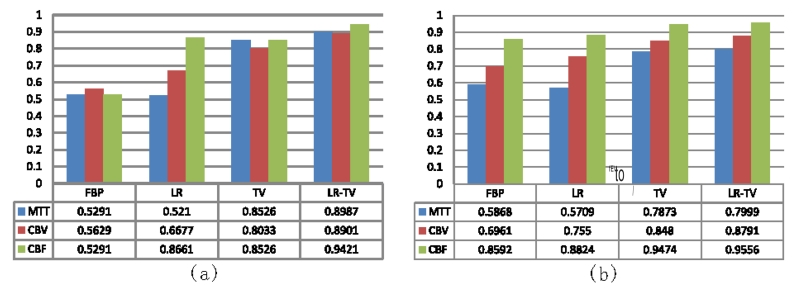
Fig.7 shows the perfusion parameter maps calculated from the true phantom images and simulated low-dose images restored using different methods. The MTT maps (column one) calculated from the LR-TV method achieved better matching results with that from the true phantom than the other methods. Furthermore, Fig.8 shows the zoomed details of the two ROIs in the perfusion parameter maps, indicating that the LR-TV method can achieve significant advantages over the other methods in terms of resolution preservation. Moreover, the corresponding UQI scores are shown in Fig.9. We can see that the LR-TV method yields higher UQI scores than the other methods.
Figure 7.
The MTT (column one), CBV (column two) and CBF (column three) maps calculated from the different digital brain perfusion images. The first row was calculated from the true phantom; the second row was calculated from the low-dose FBP image; the third, fourth and fifth rows were calculated from the simulated low-dose images restored by the FBP, LR, TV and LR-TV methods, respectively.
Figure 8.
Zoomed details of the two ROIs in the perfusion parameter maps: (a) ROI A; (b) ROI B.
Figure 9.
UQI measures on the two ROIs in Fig. 8: (a) ROI A; (b) ROI B.
3.2. Clinical study
3.2.1. Visualization-based evaluation
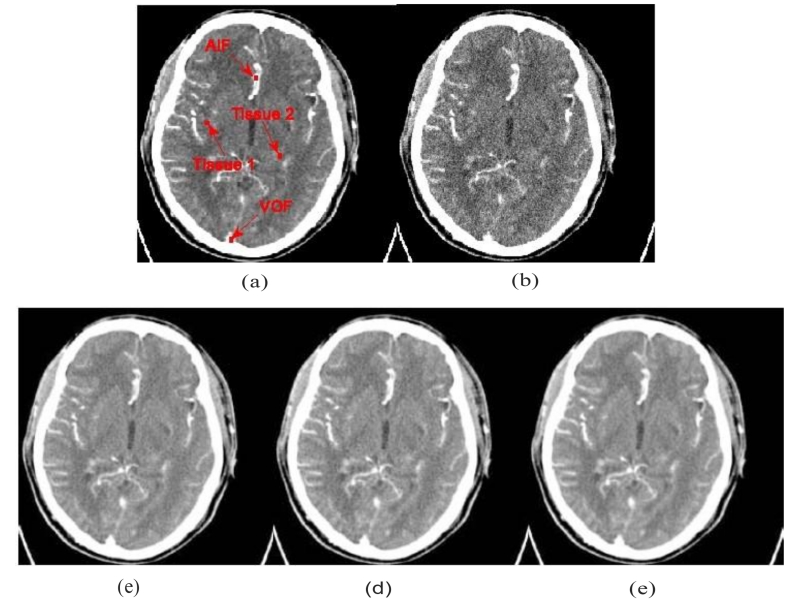
Fig.10 (a) shows the normal-dose enhanced image used as a golden standard for comparison. Fig.10 (b) shows the simulated low-dose enhanced image reconstructed using the FBP method, in which serious noise-induced artifacts that obscure enhancement information can be observed. Fig. 10 (c) shows the low-dose enhanced image restored using the LR method. Fig. 10 (d) shows the low-dose enhanced image restored using the TV method. Fig. 10 (e) shows the low-dose enhanced image restored using the LR-TV method. It can be observed that the noise level from the PCT images restored from LR-TV method is lower than that from the other methods.
Figure 10.
Cerebra1 PCT image restorations by different methods: (a) the image reconstructed by the FBP method from the norma1-dose scan; (b) the image reconstructed by the FBP method from the simulated low-dose data; (c) the image restored by the LR method from the low-dose FBP image;(d) the image restored by the TV method from the low-dose FBP image; and (e) the image restored by the LR-TV method form the low-dose FBP image.
To further visualize the differences between the three different methods, the horizontal profiles of the resulting images were drawn across the 288th row; that is, from the 100th column to the 320th column, and shown in Fig.11. The LR-TV method can produce an image that more closely match the normal-dose PCT scan compared with the other methods.
Figure 11.
Horizontal profiles (288th row, 100th column to the 320th column) of the images shown in Fig.10: (a) is the result from the LR method;(b) is the result from the TV method; and (c) is the result from the LR-TV method.
3.2.2. TDC measurement
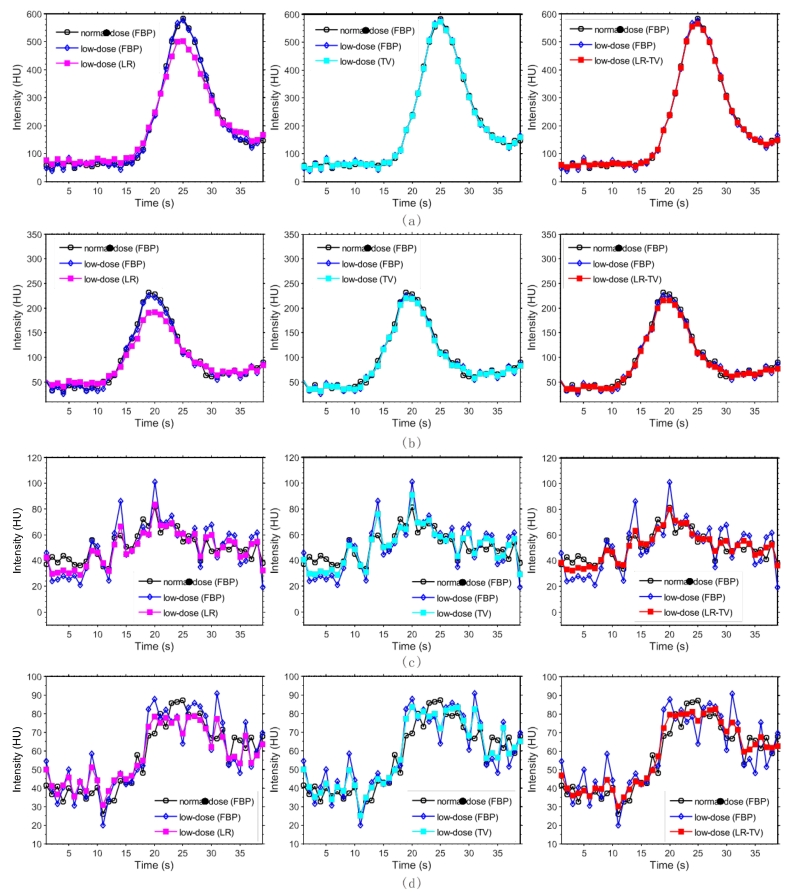
Fig. 12 depicts the TDC accuracy of the arterial input function (AIF), venous output function (VOF), and tissue perfusion of the dynamic images restored using the low-dose PCT data. The TDCs from the restored images by the LR-TV methods are closer to the normal-dose images than the other methods. To quantitatively measure the consistency between the TDC values from normal-dose FBP images and those from the simulated low-dose images restored using the LR, TV, and LR-TV methods, Table 2 lists Lin’s CC coefficients of four 3×3 ROIs, which are indicated by read squares in Fig. 10 (a). The results further suggest that the LR-TV method can achieve closer profiles using normal-dose FBP images than the other methods.
Figure 12.
TDC accuracy of the AIF, VOF and tissue perfusion of dynamic PCT images: (a) TDCs of the AIF (the 3 × 3 ROI indicated by a ‘AIF’ in Fig. 11(a)); (b) TDCs of the VOF (the 3 × 3 ROI indicated by a ‘VOF’ in Fig. 11(a)); (c) TDCs of the tissue 1 (the 3 × 3 ROI indicated by a ‘Tissue 1’ in Fig. 11(a)); and (d) TDCs of the stroke core (the 3 × 3 ROI indicated by a ‘Tissue 2’ in Fig. 11(a)).
Table 2.
Lin’s concordance correlation (CC) coefficient between the TDC values from the normal-dose image and the simulated low-dose images restored by the LR, TV and LR-TV methods. The size of each ROI is 3×3 pixels.
| ROIs | Methods | Sample size | Lin’s CC coefficient | 95% confidence interval | p-value |
|---|---|---|---|---|---|
| AIF | LR | 39 | 0.9650 | (0.9498, 0.9756) | p< 0.0001 |
| TV | 39 | 0.9922 | (0.9852, 0.9959) | p< 0.0001 | |
| LR-TV | 39 | 0.9934 | (0.9878, 0.9964) | p< 0.0001 | |
|
| |||||
| VOF | LR | 39 | 0.9817 | (0.9762, 0.9860) | p< 0.0001 |
| TV | 39 | 0.9993 | (0.9987, 0.9996) | p< 0.0001 | |
| LR-TV | 39 | 0.9995 | (0.9992, 0.9997) | p< 0.0001 | |
|
| |||||
| Tissue 1 | LR | 39 | 0.8673 | (0.7680, 0.9258) | p< 0.0001 |
| TV | 39 | 0.8661 | (0.7768, 0.9212) | p< 0.0001 | |
| LR-TV | 39 | 0.9114 | (0.8386, 0.9523) | p< 0.0001 | |
|
| |||||
| Tissue 2 | LR | 39 | 0.9012 | (0.8321, 0.9428) | p< 0.0001 |
| TV | 39 | 0.9252 | (0.862, 0.9599) | p< 0.0001 | |
| LR-TV | 39 | 0.9568 | (0.9202, 0.9768) | p< 0.0001 | |
3.2.3. Hemodynamic parameter maps’ measurement
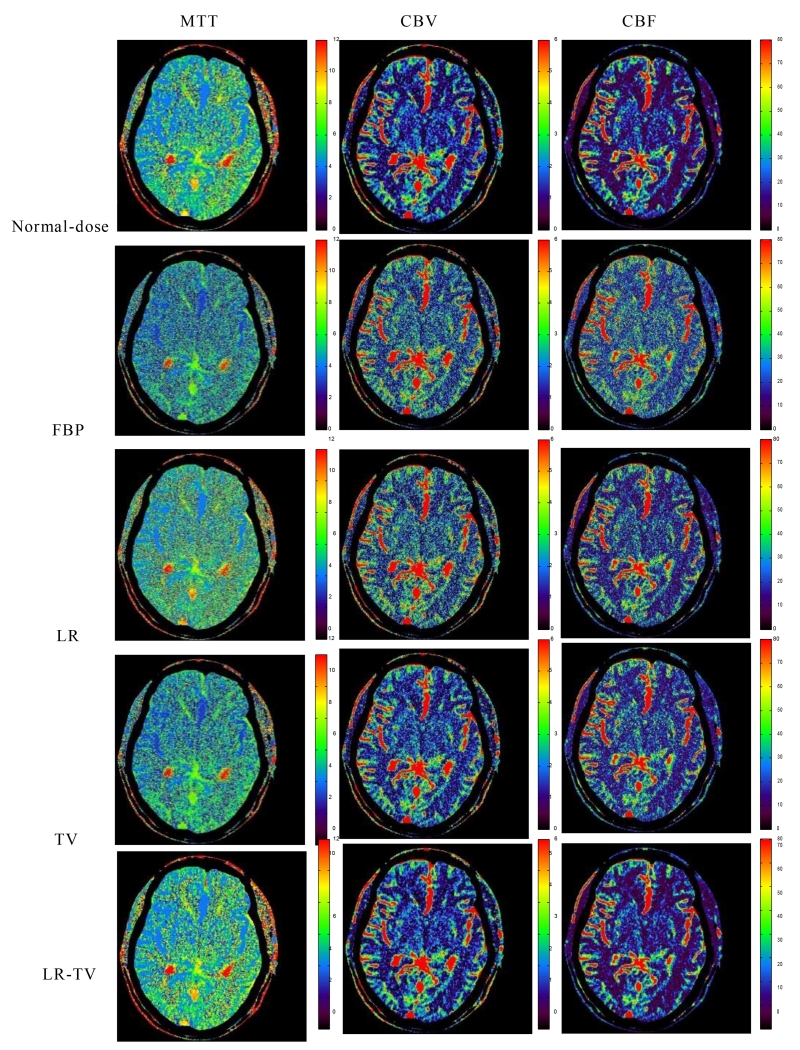
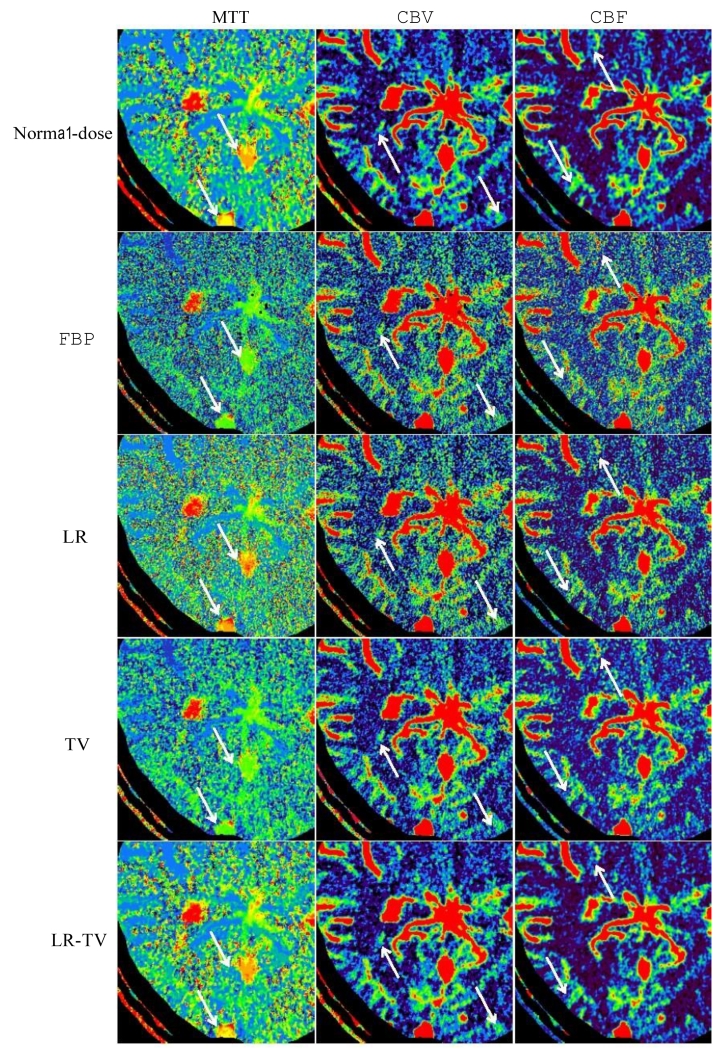
The hemodynamic parameter maps calculated from the sequential PCT images can be used as a valuable indicator to predict hemorrhagic transformation in patients with cerebrovascular disease such as acute stroke and vasospasm after subarachnoid hemorrhage. Fig. 13 shows the perfusion parameter maps calculated from the original normal-dose images and simulated low-dose images restored by different methods. It can be observed that the MTT maps (column one) derived from the LR-TV method achieves the best matching results with that of the normal-dose images. To further show the performance of the present LR-TV method, the zoomed ROIs of the MTT, CBV, and CBF maps are shown in Fig. 14. The results clearly demonstrate that the LR-TV method gets more gains than the FBP, LR and TV methods with higher fidelity to the normal-dose images and more accurate details for clinical diagnosis.
Figure 13.
The MTT (column one), CBV (column two) and CBF (column three) maps calculated from the different brain PCT images. The first row was calculated from the normal-dose images; the second row was calculated from the low-dose FBP image; the third, fourth and fifth rows were calculated from the simulated low-dose images restored by the FBP, LR, TV and LR-TV methods, respectively.
Figure 14.
Zoomed ROIs of the MTT (column one), CBV (column two) and CBF (column three) maps in Fig. 13.
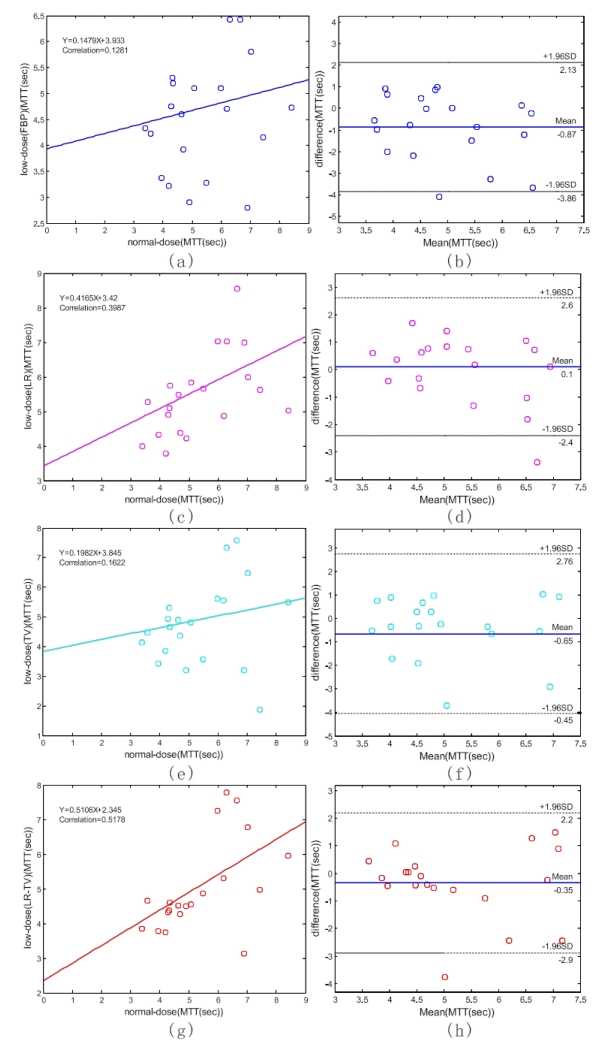
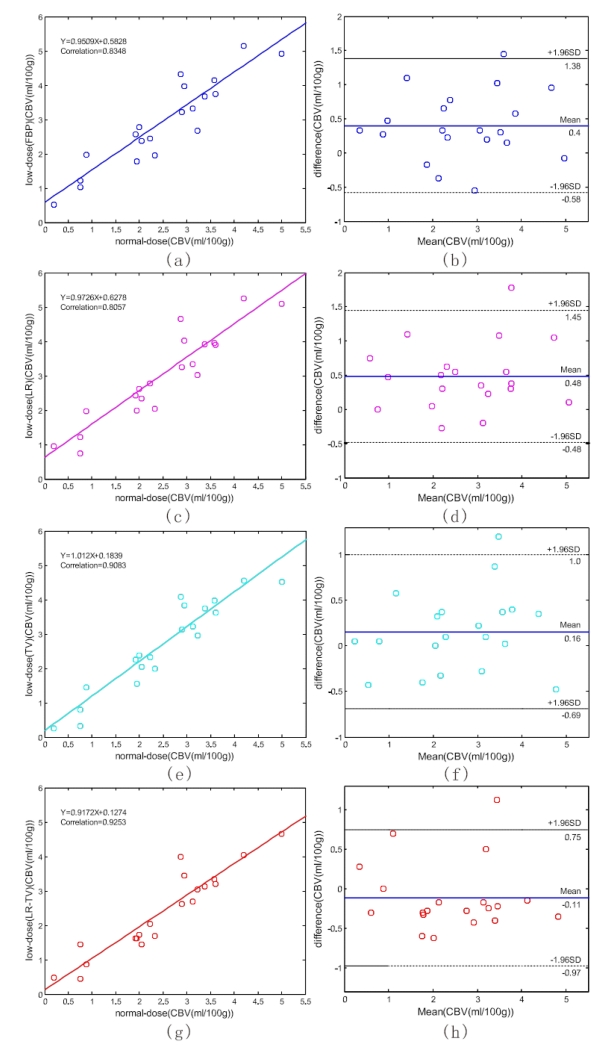
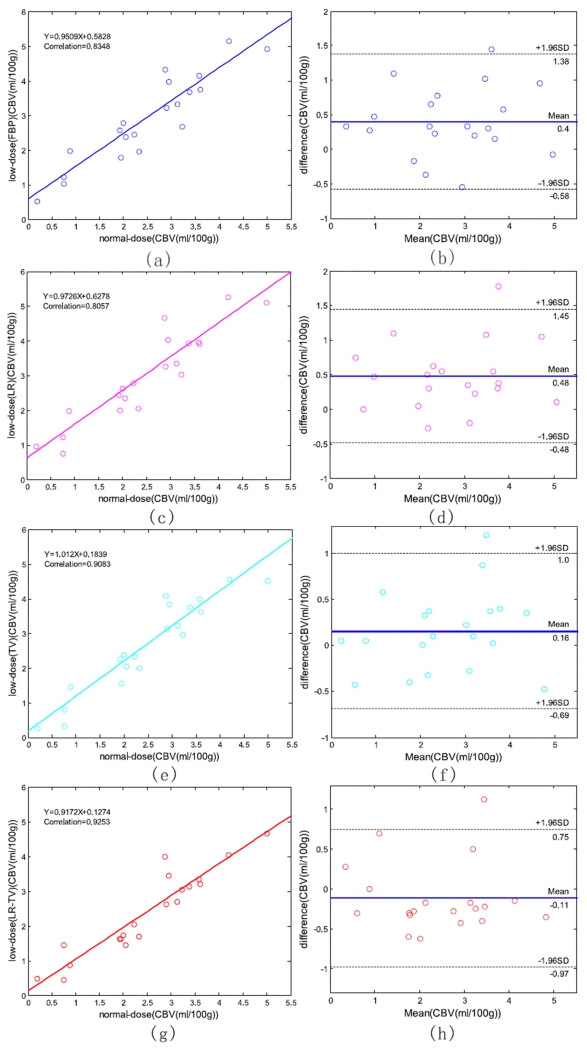
To demonstrate the merits of the present LR-TV method quantitatively, we manually selected 20 specific ROIs in Fig. 10 (a) which exclude the areas that contain major blood vessel branches and suspected abnormal signals. The ROIs were located at both hemispheres in gray matter, white matter and basal ganglia. Fig. 15 illustrates the correlation coefficients, regression results, and the corresponding Bland-Altman plots of the MTT values in different conditions. We can observe that the correlation coefficient (left column) derived from normal-dose and the low-dose images restored by the LR-TV method is higher than that from the low-dose images of other methods, whereas the difference in the ordinate axis on the Bland-Altman plot is smaller. The mean of the difference with the normal-dose measurement of the LR method is smaller compared with LR-TV method, however, the correlation coecient of LR method is smaller than LR-TV method. Because MTT value tends to be very sensitive to the changes of the tube current and is very useful for the evaluation of the extent of the cerebral perfusion reserve impairment, we may make a conjecture that the LR-TV method outperforms LR and TV methods in this perfusion study. Figs. 16 and 17 provide similar results for the CBV and CBF maps. These figures demonstrate that the present LR-TV method can achieve noticeable performance in low-dose PCT imaging while maintaining the accuracy of quantitative CT measurements for evaluating regional cerebral function.
Figure 15.
The correlation (left column) and Bland-Altman plot (right column) between the MTT map pixel values computed from the normal-dose images and the low-dose images restored by different methods. Plots (a) and (b) represent the results obtained from the normal- and low-dose FBP restorations. Plots (c) and (d) represent the corresponding results obtained from the normal-dose and the low-dose LR restorations. Plots (e) and (f) represent the corresponding results obtained from the normal-dose and the low-dose TV restorations. Plots (g) and (h) represent the corresponding results obtained from the normal-dose and the low-dose LR-TV restorations.
Figure 16.
The correlation (left column) and Bland-Altman plot (right column) between the CBV map pixel values computed from the normal-dose images and the low-dose images restored by different methods. Plots (a) and (b) represent the results obtained from the normal- and low-dose FBP restorations. Plots (c) and (d) represent the corresponding results obtained from the normal-dose and the low-dose LR restorations. Plots (e) and (f) represent the corresponding results obtained from the normal-dose and the low-dose TV restorations. Plot (g) and (h) represent the corresponding results obtained from the normal-dose and the low-dose LR-TV restorations.
Figure 17.
The correlation (left column) and Bland-Altman plot (right column) between the CBV map pixel values computed from the normal-dose images and the low-dose images restored by different methods. Plots (a) and (b) represent the results obtained from the normal- and low-dose FBP restorations. Plots (c) and (d) represent the corresponding results obtained from the normal-dose and the low-dose LR restorations. Plots (e) and (f) represent the corresponding results obtained from the normal-dose and the low-dose TV restorations. Plot (g) and (h) represent the corresponding results obtained from the normal-dose and the low-dose LR-TV restorations.
4. Discussion
Low-rank based approaches have achieved great success in image restoration, video restoration, MRI, four-dimensional and spectral CT. However, to the best of our knowledge, the low-rank matrix modeling has not been considered in low-dose perfusion CT imaging before. In fact, PCT imaging is particularly well-suited for low-rank matrix modeling by exploiting temporal and spatial correlations among PCT images. In this study, given the rich similarity redundancy information among the sequential PCT images, a low-dose PCT image restoration model was proposed by incorporating the low-rank matrix characteristic of sequential PCT images. The present method can achieve significant advantages over other existing methods in terms of high-quality low-dose PCT image restoration by suppressing the singular vectors that correspond to aliasing artifacts, as demonstrated in the results section.
As indicated by studies on the digital cerebral perfusion phantom, the present LR-TV method can monotonically converge to a steady solution with optimal parameter selections in terms of rRMSE measure. However, accurately determining all the parameters in optimization is always challenging in the general topic of regularized CT image restoration [5, 46] or reconstruction problems [37, 47]. Similar to other regularized methods, the regularization parameter is very important. A simple and effective way is to select it empirically based on heuristic guidelines. In the implementation of the present LR-TV method, β1, β2, and λ2 were determined according to the scheme introduced in [33], whereas λ1 was determined using a broader range of parameter values in terms of rRMSE and eye-appealing visualization compared the noise level of processed low-dose PCT images with the corresponding normal-dose PCT images. The used parameter determination scheme is a trial and error process. In practice, more theoretical insights and other automatic methods in optimizing the parameters should be performed, which is an interesting topic for further research.
In this paper, hemodynamic parameter maps were calculated using the TSVD deconvolution algorithm. However, the TSVD method does not exploit the spatio-temporal nature of the data, which tends to introduce unwanted oscillations and results in overestimation of hemodynamic parameters [48]. The oscillatory nature of the TSVD method initiated studies that incorporated different regularization methods to stabilize the deconvolution operation. Enforcing both temporal and spatial regularization on the residue function can further yield more noticeable advantages. Hence, the present LR-TV model can be applied in robust hemodynamic parameter maps estimation by enforcing low-rank and sparse regularization, which would be an interesting topic for further research.
5. Conclusion
To reduce the radiation dose in cerebral PCT examination, a low-dose PCT image restoration model was introduced by incorporating the low-rank matrix characteristic of sequential PCT images, given the rich redundancy information existing among enhanced sequential PCT images. The proposed LR-TV method exploits the correlation in enhanced sequential PCT images by modeling the data to have a low-rank and sparse representation. Quantitative and qualitative comparisons on digital brain perfusion phantoms and clinical cerebral PCT datasets clearly demonstrated a significant improvement in performance over FBP, LR and TV methods. Therefore, the proposed LR-TV method has powerful potential for radiation dose reduction in cerebral PCT examination.
Acknowledgments
This This work was partially supported by the National Natural Science Foundation of China (No. 61571214, No. 81371544 and No. 61262026), the National Science and Technology Major Project of the Ministry of Science and Technology of China (No. 2014BAI17B02), Science and Technology Program of Guangzhou (No. 201510010039), Natural Science Foundation of Jiangxi Province (20132BAB201026), Science and technology programm of Jiangxi Education Committee (LDJH12088), NCET Program of the Ministry of Education (NCET-13-0738), NIH/NCI (#CA143111 and #CA082402). We would like to thank the anonymous reviewers for their constructive suggestions and comments which improved the paper greatly.
References
- [1].Hoeffner EG, Case I, Jain R, Gujar Shah GV, Deveikis JP, Carlos RC, Thompson BG, Harrigan MR, Mukherji SK. Cerebral perfusion CT: technique and clinical applications. Radiology. 2004;231:632–644. doi: 10.1148/radiol.2313021488. [DOI] [PubMed] [Google Scholar]
- [2].Wintermark M, Rowley HA, Lev MH. Acute stroke triage to intravenous thrombolysis and other therapies with advanced CT or MR imaging: pro CT. Radiology. 2009;251:619–626. doi: 10.1148/radiol.2513081073. [DOI] [PubMed] [Google Scholar]
- [3].Hirata M, Sugawara Y, Fukutomi Y, Oomoto K, Murase K, Miki H, Mochizuki T. Measurement of radiation dose in cerebral CT perfusion study. Radiat. Med. 2005;23:97–103. [PubMed] [Google Scholar]
- [4].Mnyusiwalla A, Aviv RI, Symons SP. Radiation dose from multidetector row CT imaging for acute stroke. Neuroradiology. 2009;51:635–640. doi: 10.1007/s00234-009-0543-6. [DOI] [PubMed] [Google Scholar]
- [5].Ma J, Huang J, Feng Q, Zhang H, Lu H, Liang Z, Chen W. Low-dose computed tomography image restoration using previous normal-dose scan. Med. Phys. 2011;38:5713–5731. doi: 10.1118/1.3638125. [DOI] [PMC free article] [PubMed] [Google Scholar]
- [6].Ma J, Zhang H, Gao Y, Huang J, Liang Z, Feng Q, Chen W. Iterative image reconstruction for cerebral perfusion CT using pre-contrast scan induced edge-preserving prior. Phys. Med. Biol. 2012;57:7519–7542. doi: 10.1088/0031-9155/57/22/7519. [DOI] [PMC free article] [PubMed] [Google Scholar]
- [7].Wiesmann M, Berg S, Bohner G, Klingebiel R, Schopf V, Stoeckelhuber BM, Yousry I, Linn J, Missler U. Dose reduction in dynamic perfusion CT of the brain: effects of the scan frequency on measurements of cerebral blood flow, cerebral blood volume, and mean transit time. Eur. Radiol. 2008;18:2967–2974. doi: 10.1007/s00330-008-1083-x. [DOI] [PubMed] [Google Scholar]
- [8].Wintermark M, Lev MH. FDA investigates the safety of brain perfusion CT. Am. J. Neuroradiol. 2010;31:2–3. doi: 10.3174/ajnr.A1967. [DOI] [PMC free article] [PubMed] [Google Scholar]
- [9].Yu H, Zhao S, Hoffman EA, Wang G. Ultra-low dose lung CT perfusion regularized by a previous scan. Acad. Radiol. 2009;16:363–373. doi: 10.1016/j.acra.2008.09.003. [DOI] [PMC free article] [PubMed] [Google Scholar]
- [10].Wang J, Li T, Lu H, Liang Z. Penalized weighted least-squares approach to sinogram noise reduction and image reconstruction for low-dose X-ray computed tomography. IEEE Trans. Med. Imaging. 2006;25:1272–1283. doi: 10.1109/42.896783. [DOI] [PMC free article] [PubMed] [Google Scholar]
- [11].Wintermark M, Maeder P, Verdun FR, Thiran JP, Calley JF, Schnydera P, Meuli R. Using 80 kVp versus 120 kVp in perfusion CT measurement of regional cerebral blood flow. Am. J. Neuroradiol. 2000;21:1881–1884. [PMC free article] [PubMed] [Google Scholar]
- [12].Yu L, Liu X, Leng S, Kofler JM, Ramirez-Giraldo JC, Qu M, Christner J, Fletcher J, McCollough CH. Radiation dose reduction in computed tomography: techniques and future perspective. Imaging Med. 2009;1:65–84. doi: 10.2217/iim.09.5. [DOI] [PMC free article] [PubMed] [Google Scholar]
- [13].Badea CT, Johnston SM, Qi Y, Johnson GA. 4D micro-CT for cardiac and perfusion applications with view under sampling. Phys. Med. 2011;56:3351–3369. doi: 10.1088/0031-9155/56/11/011. [DOI] [PMC free article] [PubMed] [Google Scholar]
- [14].Nett BE, Brauweiler R, Kalender W, Rowley H, Chen GH. Perfusion measurements by micro-CT using prior image constrained compressed sensing (PICCS): initial phantom results. Phys. Med. Biol. 2010;55:2333–2350. doi: 10.1088/0031-9155/55/8/014. [DOI] [PMC free article] [PubMed] [Google Scholar]
- [15].Mendrik AM, Vonken EJ, van Ginneken B, de Jong HW, Riordan A, van Seeters T, Smit EJ, Viergever MA, Prokop M. TIPS bilateral noise reduction in 4D CT perfusion scans produces high-quality cerebral blood flow maps. Phys. Med. Biol. 2011;56:3857–3872. doi: 10.1088/0031-9155/56/13/008. [DOI] [PubMed] [Google Scholar]
- [16].Saito N, Kudo K, Sasaki T, Uesugi M, Koshino K, Miyamoto M, Suzuki S. Realization of reliable cerebral-blood-flow maps from low-dose CT perfusion images by statistical noise reduction using nonlinear diffusion filtering. Radiol. Phys. Technol. 2008;1:62–74. doi: 10.1007/s12194-007-0009-7. [DOI] [PubMed] [Google Scholar]
- [17].Zhu F, Carpenter T, Gonzalez DR, Atkinson M, Wardlaw J. Computed tomography perfusion imaging denoising using Gaussian process regression. Phys. Med. Biol. 2012;57:N183–N198. doi: 10.1088/0031-9155/57/12/N183. [DOI] [PubMed] [Google Scholar]
- [18].Fang R, Huang J, Luh W. A Spatio-Temporal Low-rank Total Variation Approach for Denoising Arterial Spin Labeling MRI Data; The IEEE International Symposium on Biomedical Imaging; New York City, NY, USA. 2015. [Google Scholar]
- [19].Fang R, Zhang S, Chen T, Sanelli PC. Robust Low-dose CT Perfusion Deconvolution via Tensor Total-Variation Regularization. IEEE Trans. Med. Imaging. 2015 doi: 10.1109/TMI.2015.2405015. [DOI] [PMC free article] [PubMed] [Google Scholar]
- [20].Frindel C, Robini MC, Rousseau D. A 3-D spatio-temporal deconvolution approach for MR perfusion in the brain. Med. Image Anal. 2014;18:144–160. doi: 10.1016/j.media.2013.10.004. [DOI] [PubMed] [Google Scholar]
- [21].Sidky EY, Pan X. Image reconstruction in circular cone-beam computed tomography by constrained, total-variation minimization. Phys. Med. Biol. 2008;53:4777–4807. doi: 10.1088/0031-9155/53/17/021. [DOI] [PMC free article] [PubMed] [Google Scholar]
- [22].Szczykutowicz TP, Chen G. Dual energy CT using slow kVp switching acquisition and prior image constrained compressed sensing. Phys. Med. Biol. 2010;55:6411–6429. doi: 10.1088/0031-9155/55/21/005. [DOI] [PubMed] [Google Scholar]
- [23].Ji H, Huang S, Shen Z, Xu Y. Robust video restoration by joint sparse and low rank matrix approximation. SIAM J. Imaging Sciences. 2011;4:1122–1142. [Google Scholar]
- [24].Suo J, Deng Y, Blan L, Dai Q. Joint non-Gaussina denoising and superresolving of raw high frame rate videos. IEEE Trans. Image Process. 2014;23:1154–1168. doi: 10.1109/TIP.2014.2298976. [DOI] [PubMed] [Google Scholar]
- [25].Gao H, Cai J, Shen Z, Zhao H. Robust principal component analysis-based four-dimensional computed tomography. Phys. Med. Biol. 2011;56:3183–3398. doi: 10.1088/0031-9155/56/11/002. [DOI] [PMC free article] [PubMed] [Google Scholar]
- [26].Gao H, Yu H, Ohser S, Wang G. Multi-energy CT based on a prior rank, intensity and sparsity model (PRISM) Inverse Probl. 2011;27:115012. doi: 10.1088/0266-5611/27/11/115012. [DOI] [PMC free article] [PubMed] [Google Scholar]
- [27].Lingala SG, Hu Y, DiBella E, Jacob M. Accelerated dynamic MRI exploiting sparsity and low-rank structure:k-t SLR. IEEE Trans. Med. Imaging. 2011;30:1042–1054. doi: 10.1109/TMI.2010.2100850. [DOI] [PMC free article] [PubMed] [Google Scholar]
- [28].Fieselmann A, Kowarschik M, Ganguly A, Hornegger H, Fahrig R. Deconvolution-based CT and MR brain perfusion measurement: theoretical model revisited and practical implementation details. Int. J.Biomed. Imaging. 2011:467563. doi: 10.1155/2011/467563. [DOI] [PMC free article] [PubMed] [Google Scholar]
- [29].Recht B, Fazel M, Parrilor P. Guaranteed minimum-rank solutions of linear matrix equations via nuclear norm minimization. SIAM Rev. 2010;52:471–501. [Google Scholar]
- [30].Hestenes MR. Multiplier and gradient methods. J Optimiz. Theory. App. 1969;4:303–320. [Google Scholar]
- [31].Xu Z, Chang X, Xu F, Zhang H. L1/2 regularization: A thresholding repesentation theory and a fast solver. IEEE Trans. Neur. Net. Lear. 2012;23:1013–1027. doi: 10.1109/TNNLS.2012.2197412. [DOI] [PubMed] [Google Scholar]
- [32].Candes EJ, Romberg J, Tao T. Robust uncertainty principles: Exact signal reconstruction from highly incomplete frequency inforamtion. IEEE Trans. Inf. Theory. 2006;52:489–509. [Google Scholar]
- [33].Goldstein T, Osher S. The split Bregman algorithm for l1 regularized problems. SIAM J. Imaging Sci. 2009;2:323–333. [Google Scholar]
- [34].Yin W, Osher S, Goldfarb D, Darbon J. Bregman iterative algorithms for L1 minimization with applications to compressed sensing. SIAM J. Imaging Sci. 2008;1:143–168. [Google Scholar]
- [35].Yu G, Guan L, Chen W. Spectral conjugate gradient methods with sufficient descent property for large-scale unconstrained optimization. Optim. Method Softw. 2008;23:275–293. [Google Scholar]
- [36].Cai J, Candés EJ, Shen Z. A singular value thresholding algorithm for matrix completion. SIAM J. Optimiz. 2010;20:1956–1982. [Google Scholar]
- [37].Wang J, Guan H, Solberg T. Inverse determination of the penalty parameter in penalized weighted least-squares algorithm for noise reduction of low-dose CBCT. Med. Phys. 2011;38:4066–4072. doi: 10.1118/1.3600696. [DOI] [PubMed] [Google Scholar]
- [38].Bredies K, Dong Y, Hintermüller M. Spatially dependent regularization parameter selection in total generalized variation models for image restoration. Int. J. Comput. Math. 2013;90:109–123. [Google Scholar]
- [39].Manhart MT, Kowarschik M, Fieselmann A, Deuerling-Zheng Y, Royalty K, Maier AK, Hornegger J. Dynamic iterative reconstruction for interventional 4-D C-arm CT perfusion imaging. IEEE Trans. Med. Imaging. 2013;32:1336–1348. doi: 10.1109/TMI.2013.2257178. [DOI] [PubMed] [Google Scholar]
- [40].La Riviére RJ. Penalized-likelihood sinogram smoothing for low-dose CT. Med. Phys. 2005;32:1676–1683. doi: 10.1118/1.1915015. [DOI] [PubMed] [Google Scholar]
- [41].Shepp LA, Logan BF. The fourier reconstruction of a head section. IEEE Trans. Nucl. Sci. 1974;21:21–43. [Google Scholar]
- [42].Øtergaard L, Weisskoff R, Chesler D, Gyldensted C, Rosen B. High resolution measurement of cerebral blood flow using intravascular tracer bolus passages. Part I: mathematical approach and statistical analysis. Magn. Reson. Med. 1996;36:715–725. doi: 10.1002/mrm.1910360510. [DOI] [PubMed] [Google Scholar]
- [43].Meier P, Zierler KL. On the theory of the indicator-dilution method for measurement of blood flow and volume. J. Appl. Phys. 1954;6:731–744. doi: 10.1152/jappl.1954.6.12.731. [DOI] [PubMed] [Google Scholar]
- [44].Wang Z, Bovik AC. A Universal Image Quality Index. IEEE Signal Proc. Let. 2002;9:81–84. [Google Scholar]
- [45].Lin LI. A concordance correlation coefficient to evaluate reproducibility. Biometrics. 1989;45:255–268. [PubMed] [Google Scholar]
- [46].Bian Z, Ma J, Huang J, Zhang H, Niu S, Feng Q, Liang Z, Chen W. SR-NLM: A sinogram restoration induced non-local means image filtering for low-dose computed tomography. Comput. Med. Imag. Grap. 2013;37:293–303. doi: 10.1016/j.compmedimag.2013.05.004. [DOI] [PMC free article] [PubMed] [Google Scholar]
- [47].Niu S, Gao Y, Bian Z, Huang J, Chen W, Yu G, Liang Z, Ma J. Sparse-view x-ray CT reconstruction via total generalized variation. Phys. Med. Biol. 2014;59:2997–3017. doi: 10.1088/0031-9155/59/12/2997. [DOI] [PMC free article] [PubMed] [Google Scholar]
- [48].Mouridsen K, Friston K, Hjort N, Gyldensted L, Østergaard L, Kiebel S. Bayesian estimation of cerebral perfusion using a physiological model of microvasculature. NeuroImage. 2006;33:570–579. doi: 10.1016/j.neuroimage.2006.06.015. [DOI] [PubMed] [Google Scholar]


