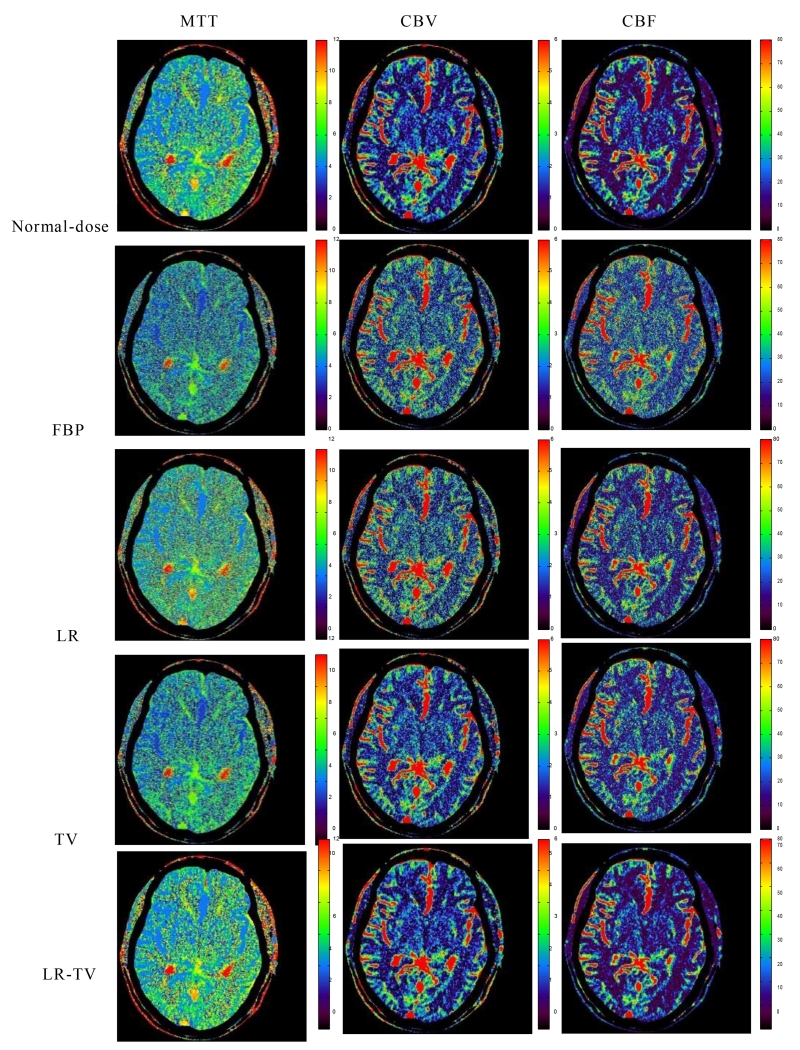
Figure 13.
The MTT (column one), CBV (column two) and CBF (column three) maps calculated from the different brain PCT images. The first row was calculated from the normal-dose images; the second row was calculated from the low-dose FBP image; the third, fourth and fifth rows were calculated from the simulated low-dose images restored by the FBP, LR, TV and LR-TV methods, respectively.

