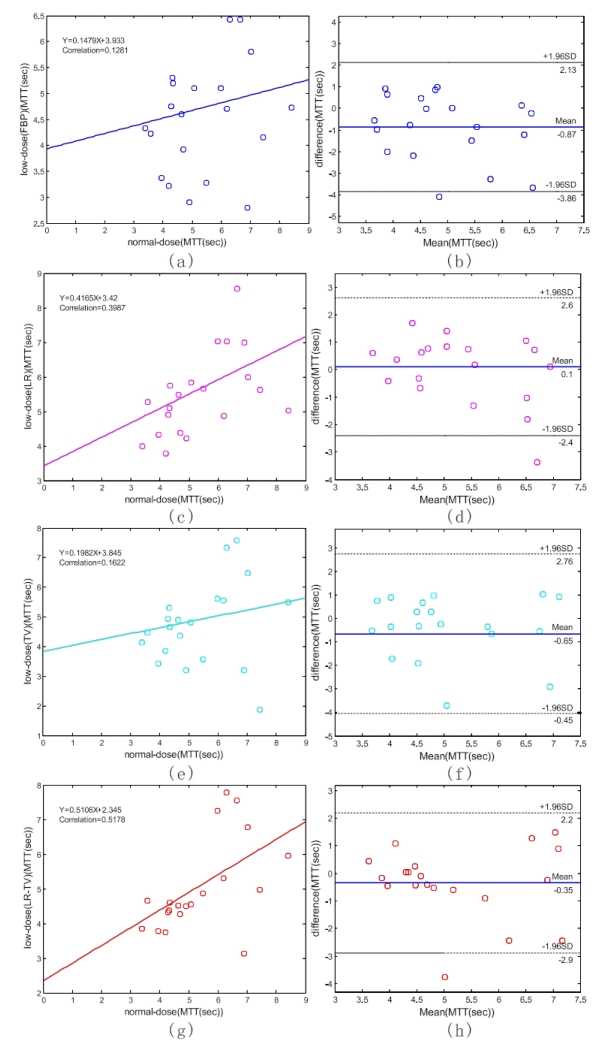
Figure 15.
The correlation (left column) and Bland-Altman plot (right column) between the MTT map pixel values computed from the normal-dose images and the low-dose images restored by different methods. Plots (a) and (b) represent the results obtained from the normal- and low-dose FBP restorations. Plots (c) and (d) represent the corresponding results obtained from the normal-dose and the low-dose LR restorations. Plots (e) and (f) represent the corresponding results obtained from the normal-dose and the low-dose TV restorations. Plots (g) and (h) represent the corresponding results obtained from the normal-dose and the low-dose LR-TV restorations.

