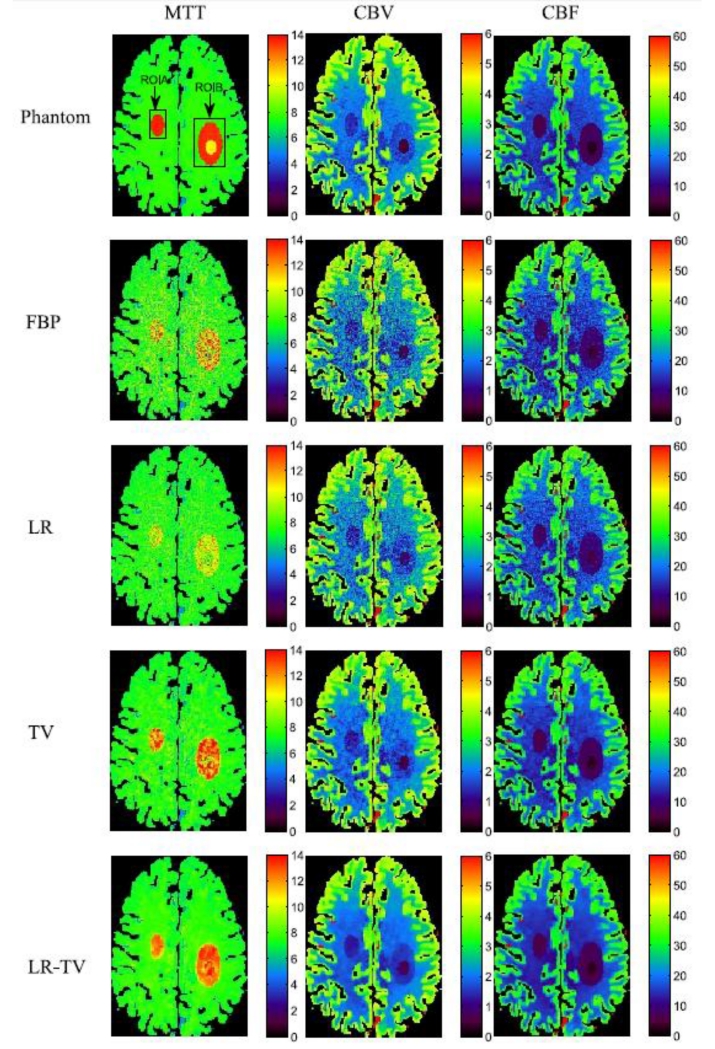
Figure 7.
The MTT (column one), CBV (column two) and CBF (column three) maps calculated from the different digital brain perfusion images. The first row was calculated from the true phantom; the second row was calculated from the low-dose FBP image; the third, fourth and fifth rows were calculated from the simulated low-dose images restored by the FBP, LR, TV and LR-TV methods, respectively.

