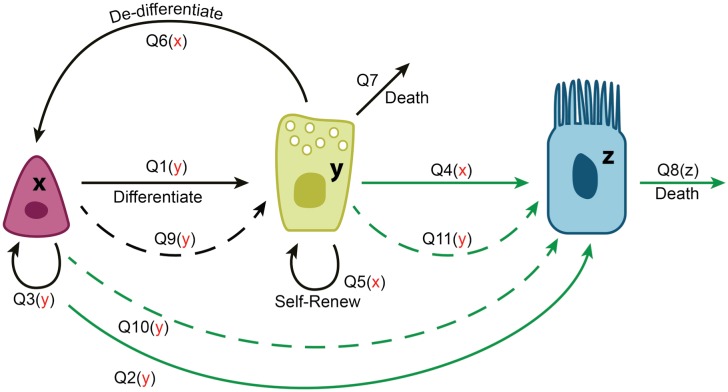
Fig 1. A schematic showing the cellular processes in the model of airway epithelium.
The three types of cells are depicted (from left to right): SCs, SecrCs, and CilCs. They are denoted by the variables x, y, and z respectively. The processes are shown by arrows, where dashed lines denote asymmetric divisions, see also Table 1. For each process, its regulation, if any, is shown in the brackets, with red symbols denoting negative regulation. Processes that contribute to the slow dynamics of CilCs are denoted by greed arrows.

