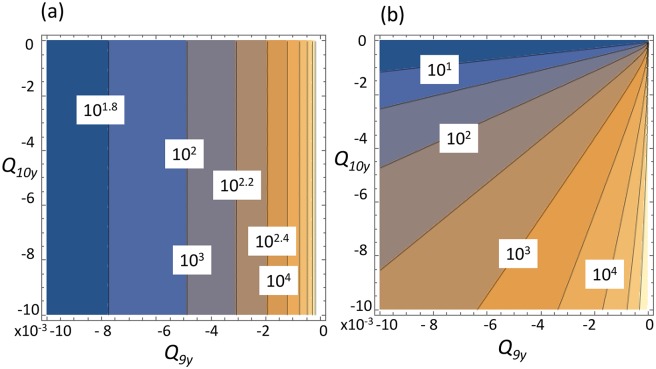
Fig 3. The variance of (a) SecrCs and (b) CilCs as a function of system’s parameters.
Two controls are varied: Q9y measures the strength of inhibition of SC differentiation into SecrCs, and Q10y measures inhibition of differentiation into CilCs. The contour plots have the levels marked. The rest of the parameters are Q4 = 0.00078 − 0.0074(x − x0),Q5 = 0.041 − 0.0058(x − x0),Q6 = 0.32 − 0.0043(x − x0),Q7 = 0.937,Q8 = 0.0056 + 0.001(z − z0),Q9 = 0.0057 + Q9y(y − y0),Q10 = 0.467 + Q10y(y − y0); x0 = 250, y0 = 200, z0 = 550.

