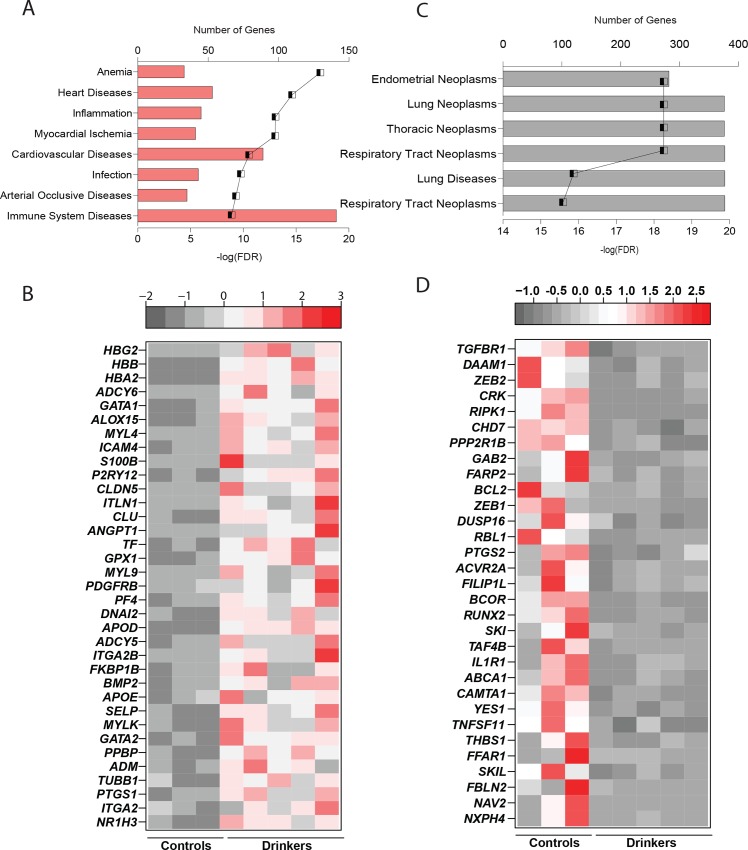
Fig 5. Chronic heavy ethanol consumption changes the expression of genes involved in heart diseases and cancer.
(A) Bar graph depicting 8 disease terms enriched among the up-regulated genes. The line graph in both figures represents negative log (FDR) of the enriched term. (B) Heatmap of up-regulated genes involved in cardiovascular diseases. (C) Bar graph depicting 8 disease terms enriched among the down-regulated genes. (D) Heatmap of the down-regulated genes involved in cancer.

