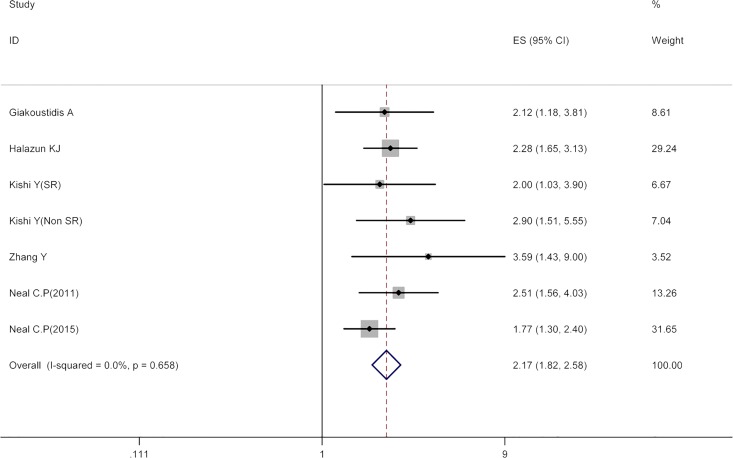
Fig 2. Results of the meta-analysis on pooled HR values for OS.
Each square denotes the HR for that trial comparison with the horizontal lines showing the 95% CIs. The size of the square is directly proportional to the amount of information contributed by the trial. The blue hollow diamond gives the pooled HR from the fixed effect model; the centre of this diamond denotes the HR and the extremities the 95% CI.

