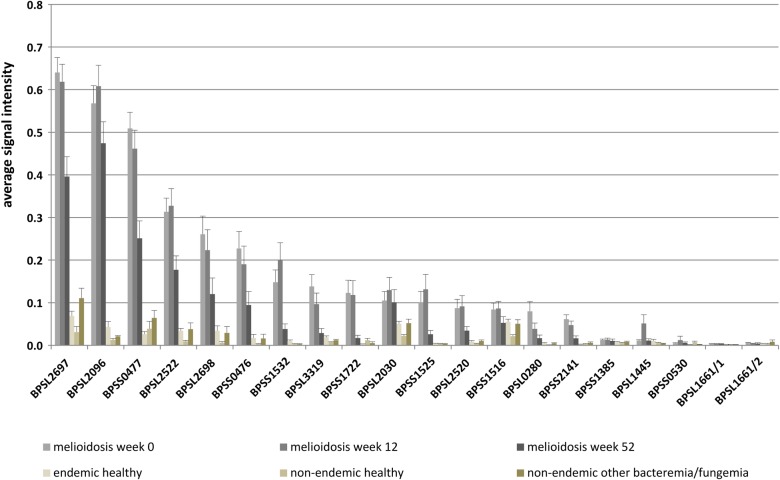
Fig 3. Average signal intensities of IgG antibodies bound to B. pseudomallei proteins probed with melioidosis-positive and negative control samples.
The diagram shows the average signal intensity of each antigen (spotted protein solution of 0.45 mg/ml) incubated with sera from melioidosis-positive groups (week 0, 12 and 52 p.a.), healthy control individuals from endemic and non-endemic areas, as well as samples from patients with other bacteremia or fungaemia obtained in the non-endemic area of Greifswald. Not shown are values for antigens with His-tag. Error bars indicate standard error of the mean (SEM).

