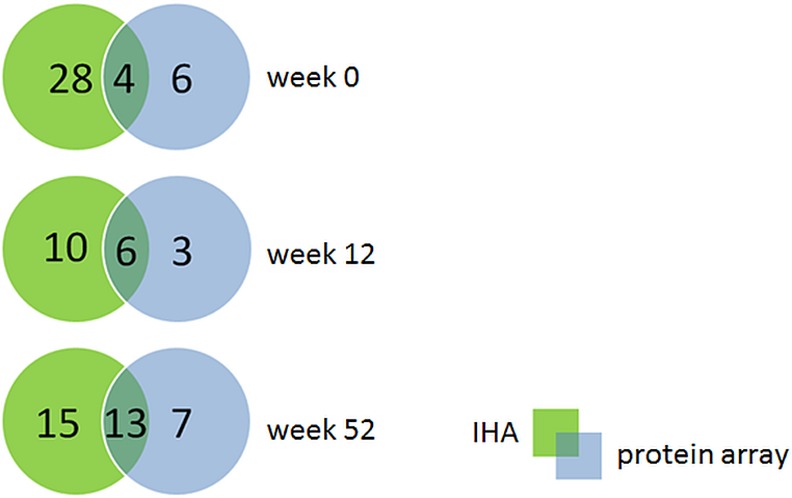
Fig 7. Comparison of false-negative signals between IHA and the protein array.

VENN diagrams show the false-negative signals of IHA and the protein array using the melioidosis-positive sera of weeks 0 (n = 75), 12 (n = 50), and 52 (n = 46). Green shows the false-negative signals only for the IHA and blue only for the protein array. The overlaps are false-negative signals obtained by both methods. The cut-off IHA titer used was ≥160.
