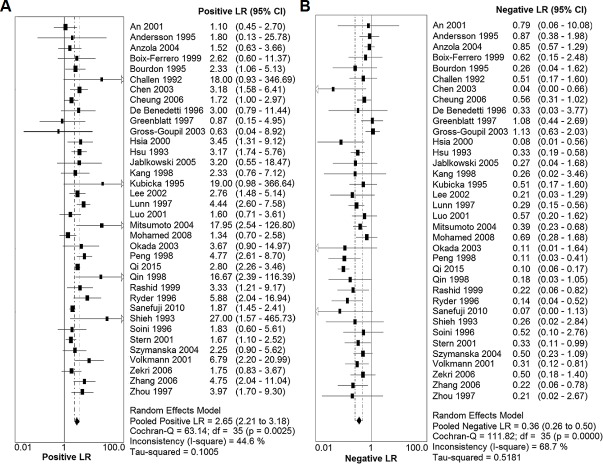
Fig 3. Forest plot of the positive likelihood ratio (PLR) and the negative likelihood ratio (NLR) of IHC-determined p53 overexpression in detecting p53 mutations.
(A) Forest plot showing the positive LR of IHC-determined p53 overexpression in detecting p53 mutations. (B) Forest plot showing the negative LR of IHC-determined p53 overexpression in detecting p53 mutations.

