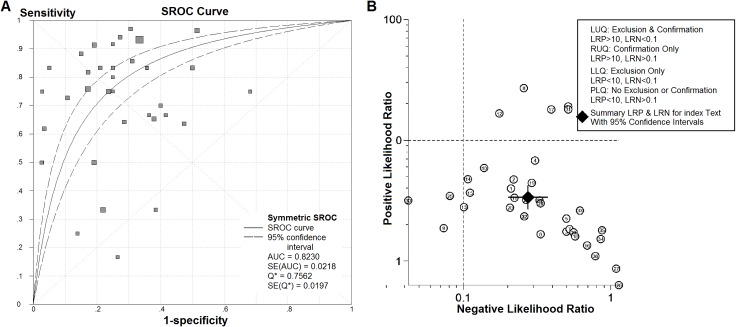
Fig 4. The summary receiver operating characteristic (SROC) curve and the likelihood ratio scattergram for IHC-determined p53 overexpression in the identification of p53 mutations in HCC for all studies.
(A) The SROC curve summarizes the overall diagnostic accuracy of IHC-determined p53 overexpression for the identification of p53 mutations. The size of the dots for 1-specificity and sensitivity of the single studies in the ROC space reflects the sample size (number of patients) in the study. (B) The likelihood ratio scattergram shows the diagnostic performance of IHC-determined p53 overexpression in the identification of p53 mutations. Q* = point at which sensitivity and specificity were equal.

