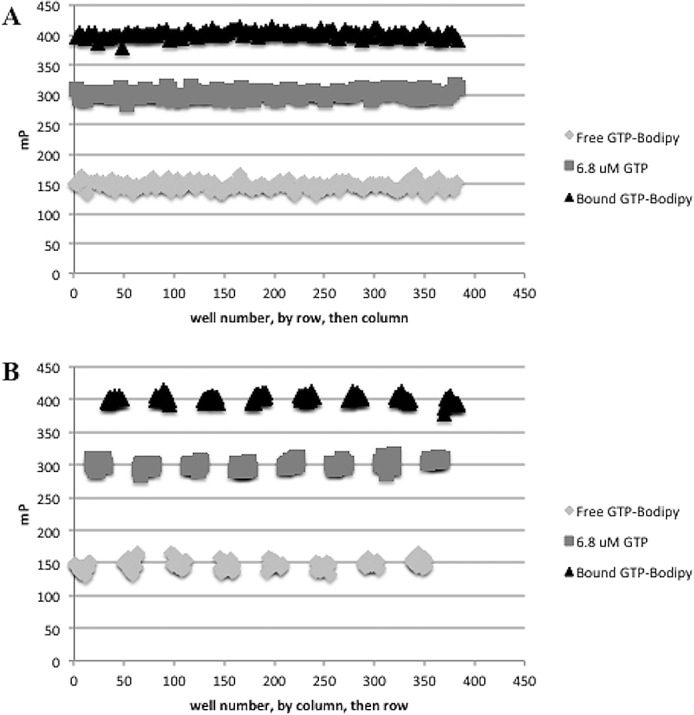
Fig 5. Drift and Edge Effects.

In order to determine if there were any drift or edge effects, we used an interleaved plate format and plated three types of FP signals in alternating columns. Minimum signal wells contained 10 nM GTP-Bodipy in FP binding buffer only, midpoint signal wells contained CHIKV nsP1, GTP-Bodipy in FP binding buffer, and 6.8 μM GTP and maximum signal wells contained CHIKV nsP1 and GTP-Bodipy in binding buffer. Plates were incubated for 1 hour at 25°C in the dark and scanned for FP. Values were plotted on a scatter plot with FP signal on the y-axis and (A) well by row, then column on the x-axis and also with (B) well by column, then row on the x-axis. n = 3.
