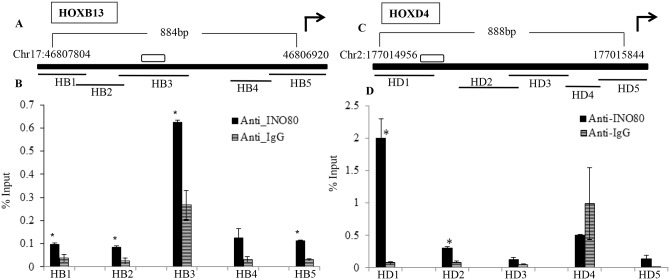
Fig 8. In vivo localization of INO80 in the upstream regions of its target genes.
The data from ChIP followed by qPCR for HOXB13 (A & B) and HOXD4 (C & D) are shown. A & C- Line diagram indicating the upstream region analysed by qPCR of ChIP DNA as thick black line mapping on chromosome17 and 2 for HoxB13 and HoxD4 respectively along with the genomic positions, the bent arrow indicates the direction of transcription of the gene, unfilled box is the hINO80 binding motif present in the upstream region. HB1-HB5 and HD1-5 are the amplicons originating from the upstream region covering 884bp and 888bp of HoxB13 and HoxD4 respectively using primers listed (S2B Table). B&D show the enrichment as % Input for each region HB1-HB5 (B) and HD1-HD3(C), (*p value<0.05 and **p<0.001 in comparison with IgG for each primer set).

