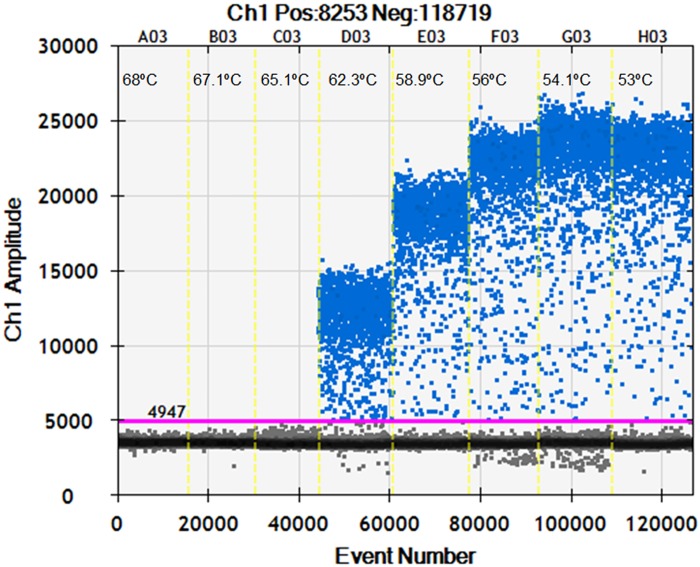
Fig 1. Fluorescence amplitude plotted against annealing temperature gradient.
The unbroken pink line is the threshold, above which are positive droplets (blue) with PCR amplification and below which are negative droplets (gray) without any amplification. Eight ddPCR reactions with the same amount of targets are divided by the vertical dotted yellow line. The reactions were across an annealing temperature gradient: 53, 54.1, 56, 58.9, 62.3, 65.1, 67.1 and 68.0°C. The optimal range of annealing temperatures giving the largest difference in fluorescence between negative and positive droplets was between 52°C and 55.4°C.

