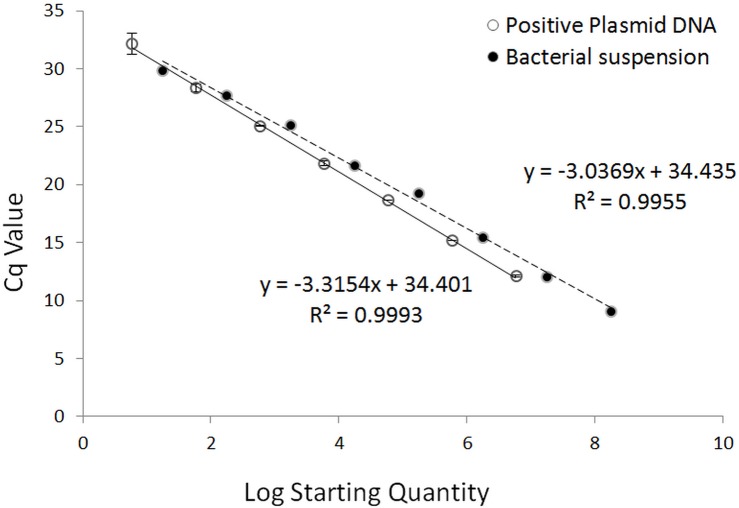
Fig 2. Calibration curves of qPCR assays run with positive plasmid DNA (unbroken line) and bacterial suspension (broken line).
Plasmid DNA was tenfold diluted serially from 5.88E+6–5.88E+0 copies/μL. The slope of the plasmid DNA standard curve is –3.3154, equivalent to an efficiency of 100.3% (R2 = 0.9993). The bacterial suspension was 10-fold serially diluted from 1.78E+8–1.78E+1 CFU/μL. The slope of the bacterial suspension calibration curve is –3.0369, equivalent to an efficiency of 113.5% (R2 = 0.9955), indicating PCR inhibition probably caused by the residual medium matrix.

