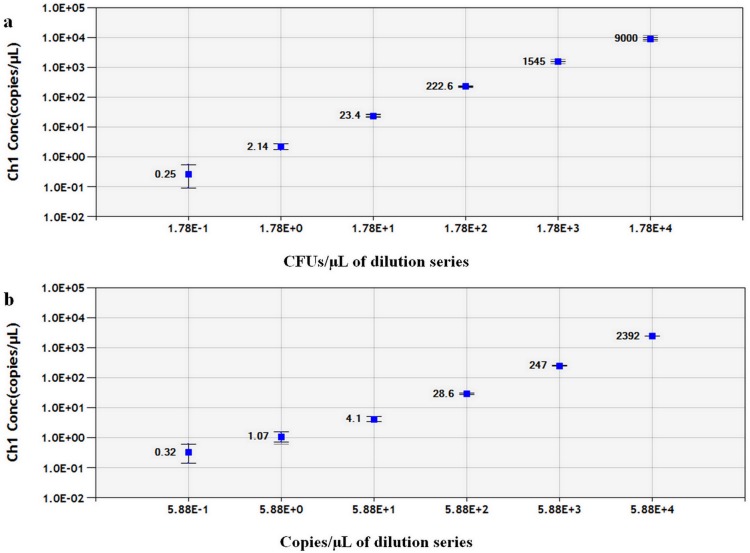
Fig 3. Linear regression of the ddPCR assay for (a) bacterial suspension and(b) positive plasmid DNA constructed by the same serial dilution series tested with the qPCR assay (see Fig 2).
The estimated Pearson correlation coefficient of the bacterial suspension regression curve (y = 1.9902x—283.81) is 0.995 (R2 = 0.995, P< 0.0001) and that of the plasmid DNA regression curve (y = 24.607x—74.083) is 1.0 (R2 = 1.0, P< 0.0001). Both standards tested by ddPCR exhibited a dynamic range of five orders of magnitude. The vertical axis shows the log10-transformed copy number/μL of the ddPCR reaction mixture. The horizontal ordinate indicates (a) the log10-transformed expected concentration of CFU/μL of the ddPCR reaction mixture or (b) the log10-transformed expected copy number/μL of the ddPCR reaction mixture. The inner error bars indicate the Poisson 95% confidence interval (CI) and the outer error bars show the total 95% CI of replicates.

