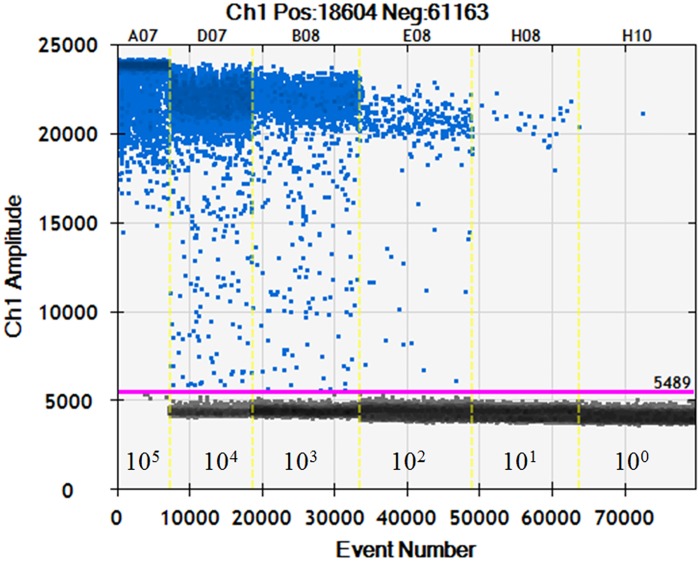
Fig 4. Representative 1-D plot of ddPCR reactions.
The ordinate scales indicate fluorescent amplitude. The unbroken pink line is the threshold, above which are positive droplets (blue) containing at least one copy of target DNA and below which are negative droplets (gray) without any target DNA. Six ddPCR reactions with various serially diluted targets are divided by the vertical dotted yellow line. The leftmost ddPCR reaction was saturated by an excess target concentration and the rightmost reaction contains a single copy of the target.

