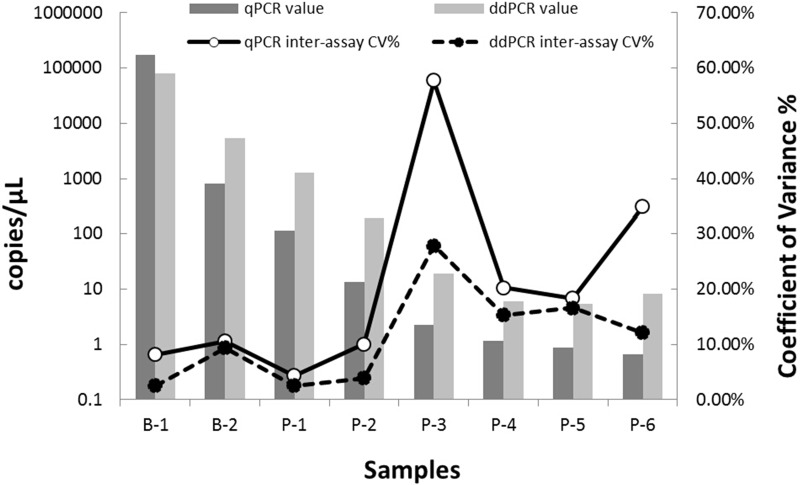
Fig 5. Inter-assay CV% of the qPCR and ddPCR assays.
Samples B-1 and B-2 are bacterial suspensions in high concentration. Samples P-1 –P-6 are positive plasmid DNA; among them, P-1 and P-2 are of high concentration and P-3 –P-6 are of low concentration. Histograms indicate the average copy number of each sample in log 10 scale. Lines show the trend of variation of CV of the qPCR and ddPCR assays with repeated tests of diverse sample concentrations. The ddPCR assay is more precise compared to the qPCR assay for quantification of Xcc, especially for low target concentrations (numerical data supporting Fig 5 are given in S3 Table).

