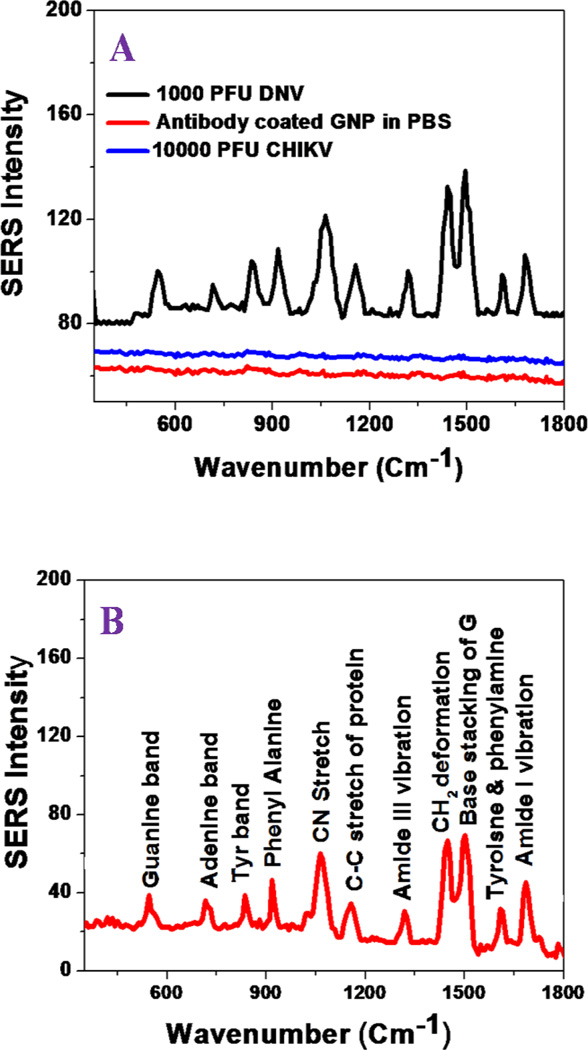
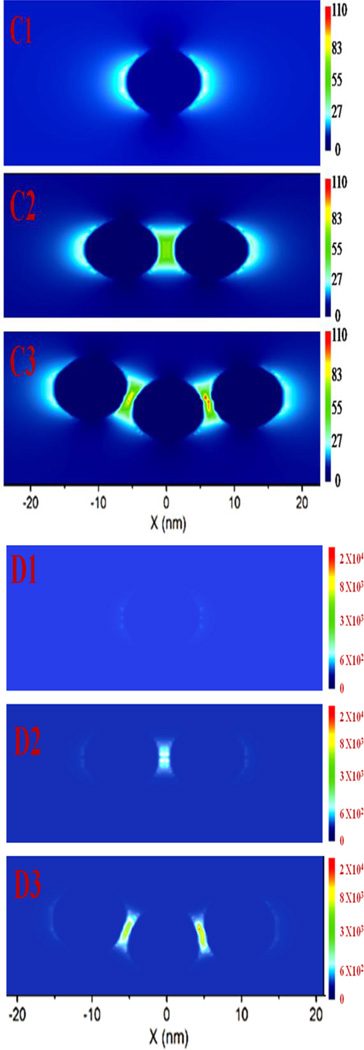
Figure 2.
(A) SERS spectra show no Raman signal from 4G2 antibody-conjugated gold nanoparticle. Similarly, no Raman signal was observed in the presence of CHIKV. Conversely, Raman signal was observed in the presence of WNV. It is mainly due to the formation of assembly structure in the presence of WNV. (B) Spectrum shows SERS band assignment from WNV conjugated nanoassembly. Observed SERS signal is directly from the WNV. (C1–C3) Simulated electric field enhancement |E|2 profiles in arbitrary units for monomer and nanoparticle assembly. Calculation has been performed using finite-difference time-domain (FDTD) simulation using the 10 nm particle size and separation distance kept at 2 nm. For trimmer structure we have used bent structure, shown in Figure 1C. (D1–D3) Simulated electric field enhancement |E|4 profiles in arbitrary units for monomer and nanoparticle assembly.


