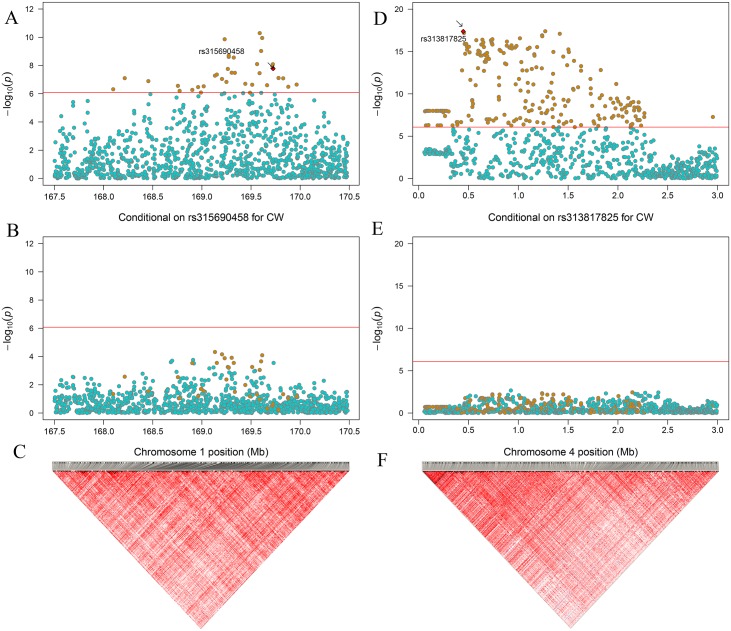
Fig 3. Regional plot for single nucleotide polymorphisms (SNPs) at GGA1 spanning from 167.5–170.5 Mb.
Plot A: In the region 167.5 to 170.5 Mb the -log10 (observed P values) of the SNPs (y-axis) are presented according to their chromosomal positions (x-axis). Thirty-seven SNPs reached a genome-wide significance level (orange dot, 8.43 × 10⁻⁷). Plot B: The genotype of rs315690458 was placed into the univariate test as covariance for conditional analysis. After conditioning on rs315690458, the significant SNPs in plot A (orange dot) were all substantially attenuated below genome-wide significant level in plot B. Plot C: Two hundred and seventeen small-scale blocks were observed in this region.

