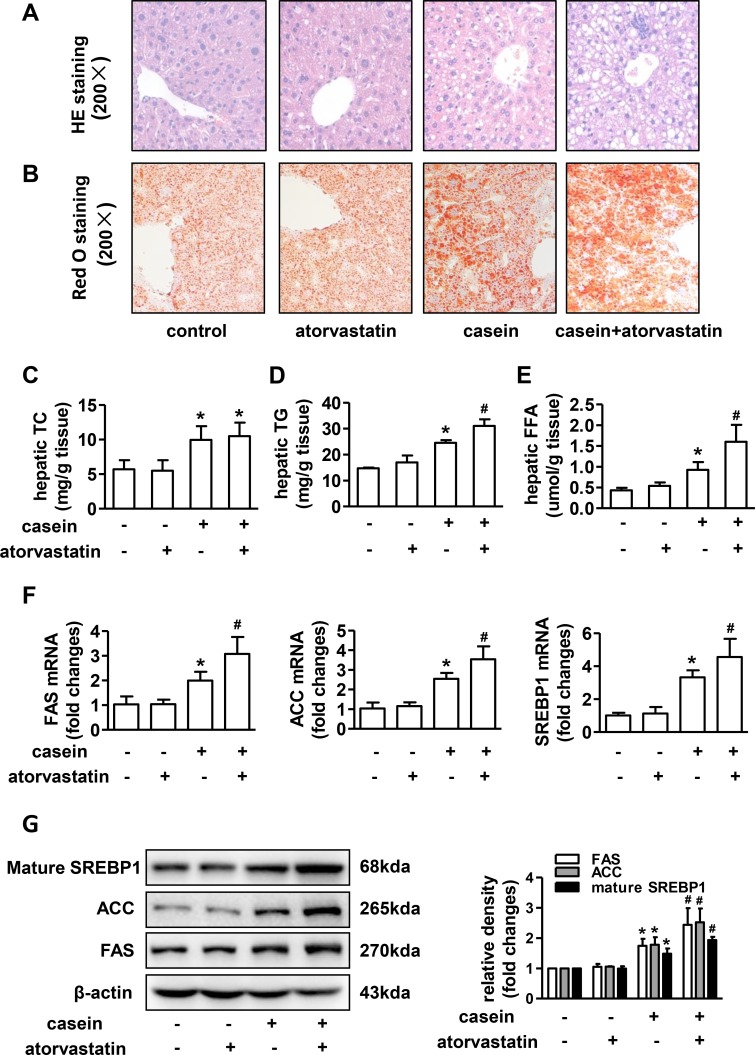
Fig 1. Effect of atorvastatin on lipid accumulation in livers of ApoE-/- mice.
Liver sections of representative mice from each group were stained with (A) H&E or (B) Oil Red O. The contents of liver (C) TC, (D) TG and (E) FFA were quantified as described in methods (n = 6). (F) The mRNA expressions of lipogenic genes in livers of ApoE-/- mice (n = 6). (G) The protein expressions of lipogenic genes in livers of ApoE-/- mice (n = 3). The histogram represents the densitometric scans for target protein bands normalized by β-actin and expressed as fold changes relative to protein expression in control mice. The results are depicted as mean ± SD, *P<0.05 versus control group, #P<0.05 versus casein injected alone group.

