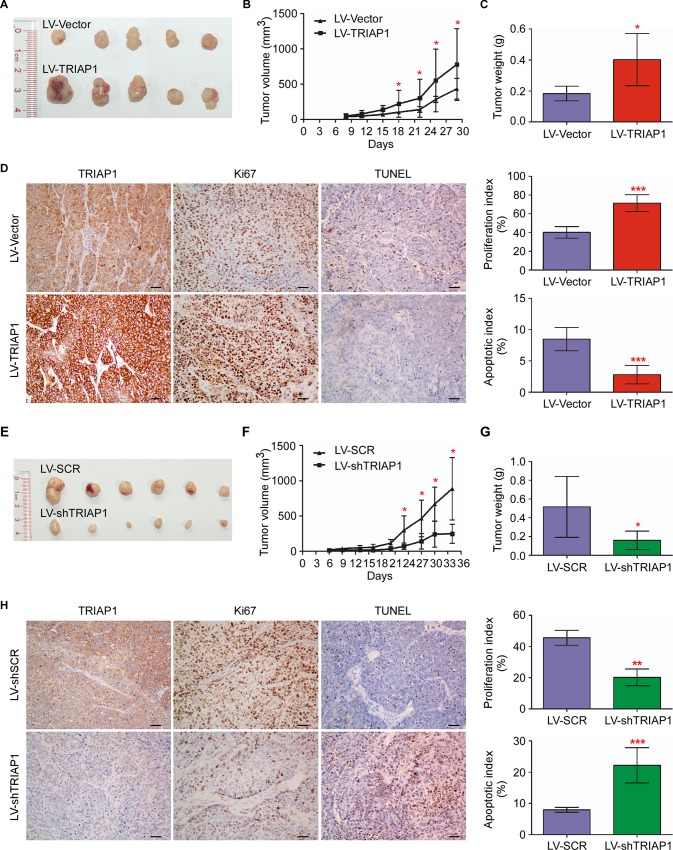
Fig 3. TRIAP1 promotes NPC cell growth and inhibits apoptosis in vivo.
(A-C) Representative images (A), tumor volume growth curves (B) and weight (C) of tumors developed in xenograft models subcutaneously injected with SUNE-1 cells stably expressing the empty vector or overexpressing TRIAP1. (D) Representative images (left panel) and quantification of the percentage (right panel) of Ki67-positive and TUNEL-positive cells in xenografts. Scale bar, 50 μm. (E-G) Representative images (E), tumor volume growth curves (F) and weight (G) of tumors developed in xenograft models subcutaneously injected with SUNE-1 cells stably expressing the scrambled control (SCR) or TRIAP1-specific shRNA (shTRIAP1). (H) Representative images (left panel) and quantification of percentage (right panel) of Ki67-positive and TUNEL-positive cells in xenografts. Scale bar, 20 μm. The data are presented as the mean ± s.d. Student’s t-test, * P < 0.05, ** P < 0.01, *** P < 0.01.

