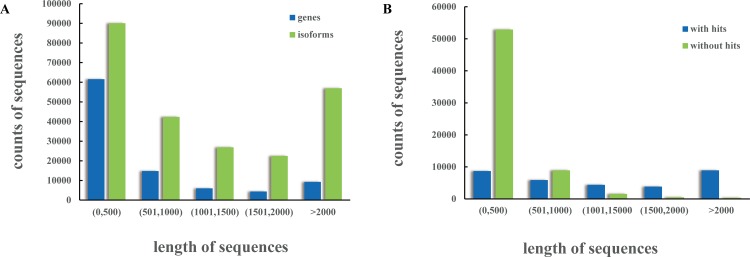
Fig 1. Length distribution of assembled sequences.
(A) The counts of genes and isoforms assembled decreases along with length. The length of genes and isoforms are represented on the X-axis, while the number is on the Y-axis. (B) The counts of unigenes without matches (with a cut-off E-value of 10E-5) in the NCBI NR database decreases along with length. The length of matched and unmatched genes are represented on the X-axis while the number of them is on the Y-axis.

