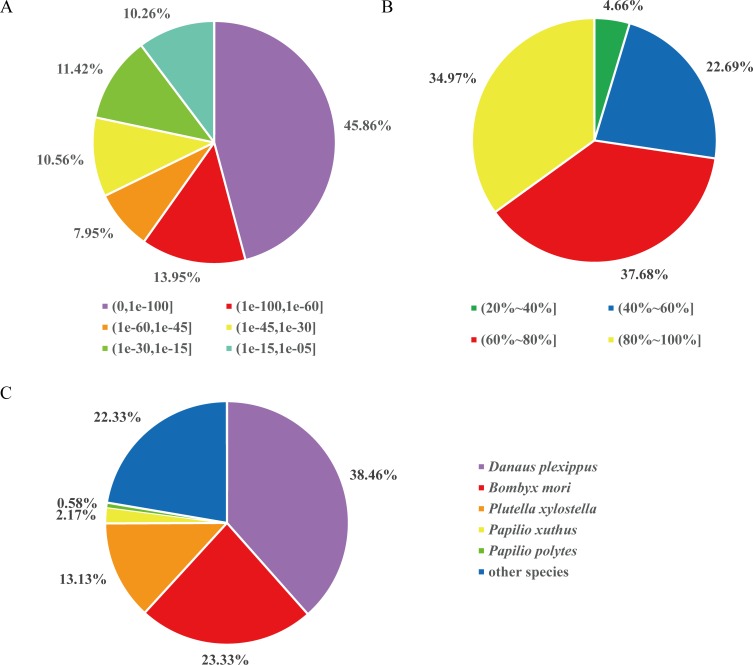
Fig 2. Characteristics of homology search of genes against the NR database.
(A) E-value distribution of BLAST hits for each unigene with a cut-off of E-value of 10E-5. (B) Similarity distribution of the top BLAST hits for each unigene. (C) Species distribution is shown as percentage of the total homologous gene hits. All of the top five species are Lepidoptera.

