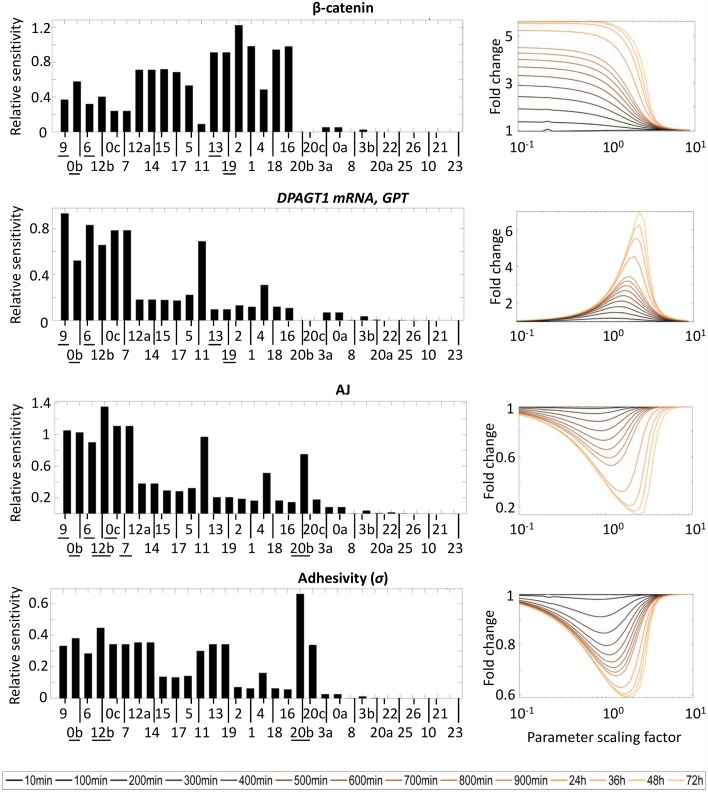
Fig 3.
(LEFT) Sensitivity to changes in individual reactions of fold-change (upon activation of Wnt/β-catenin signaling) in β-catenin, DPAGT1 mRNA and GPT, AJ, and E-cadherin adhesivity at steady-state. Reaction labels refer to numbering used in Fig 2; repeated numbers used for processes described by more than one parameter. Reaction labels along the horizontal axis are organized from left to right in order of decreasing sensitivity averaged over all molecules in network. (RIGHT) Dependence of fold-change in chosen molecules in time to changes in reaction 11 (i.e. binding equilibrium of β-catenin and TCF). The horizontal axis represents the factor by which the parameter describing binding dynamics is scaled.

