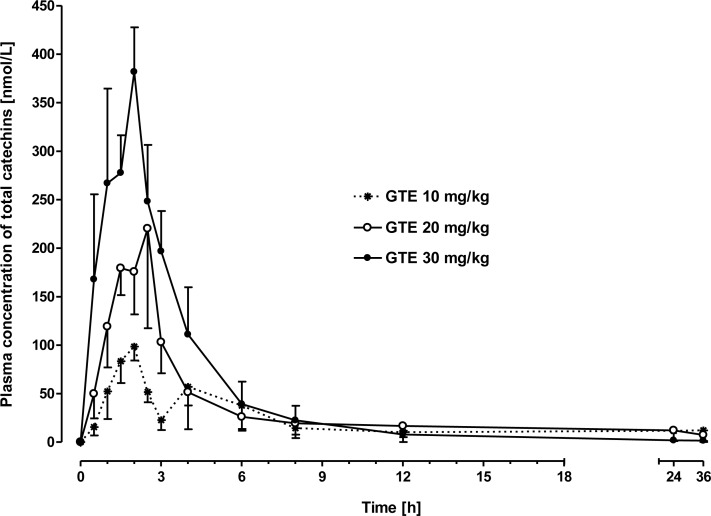
Fig 4. Plasma concentration-time curves of total catechins (TC) as the sum of conjugated and non-conjugated forms after intraduodenal application of green tea extract (GTE) at doses of 10, 20 or 30 mg/kg BW, respectively.
Total plasma catechins were calculated according to: TC [nmol/L] = C + EC + EGC + EGCG + ECG + GC. Values are means ± SEM of 6 lactating cows.

