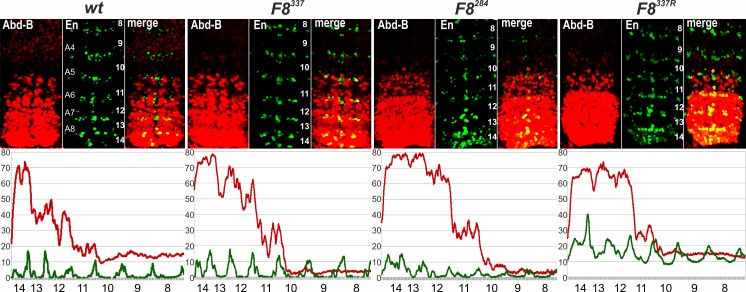
Fig 6. Patterns of Abd-B expression in CTCF×4, Fab8337, Fab8284, and Fab8337R.
Embryos were stained and marked as in Fig 3. Like wild type, Abd-B expression in PS10-13 in F8337 embryos increases in a stepwise pattern from one parasegment to another. In F8284 embryos, the level of Abd-B in PS12 is elevated and close to that of PS13. In F8337R, expression levels of Abd-B in PS13 and PS12 are nearly equal, while the Abd-B expression in PS11 is reduced. The lower panels show plot profiles of relative fluorescence intensity in the respective images from the upper panels, red lines for Abd-B and green lines for En. Parasegments are numbered from 8 to 14; approximate positions of segments are shown on the left side of the wild type (wt) panel and marked A4 to A8 (see Fig 1A for the adult segment numbering).

