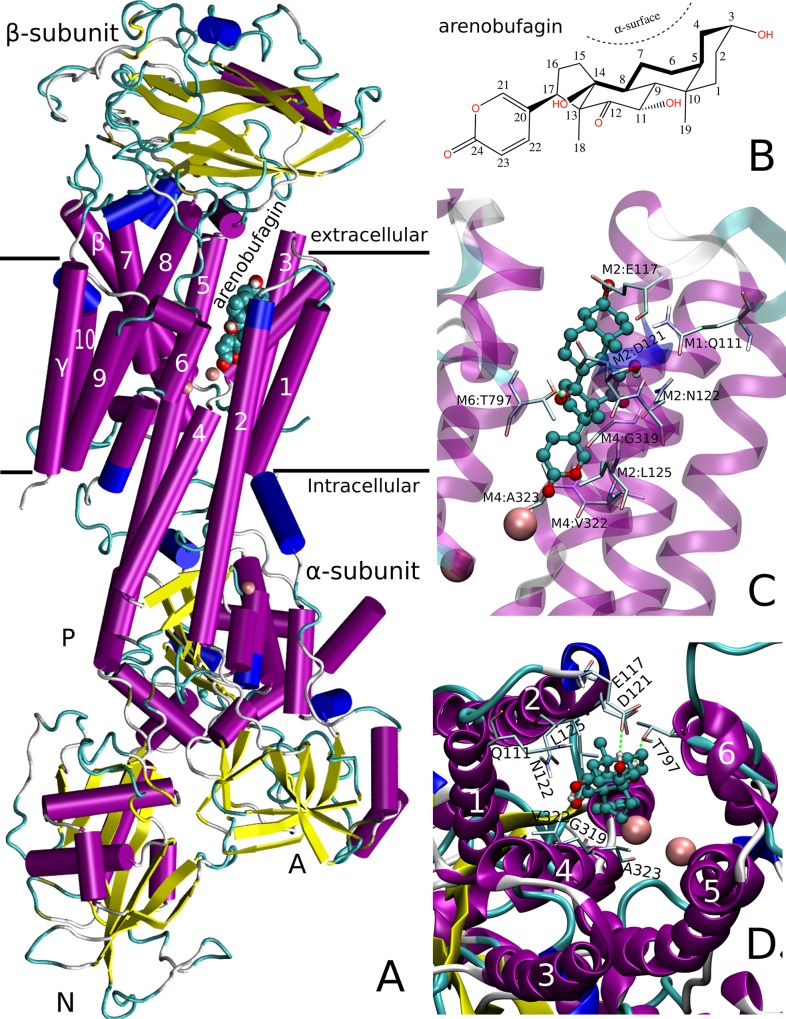
Fig 4. The molecular structures of Na, K-ATPase α1β1γ E2P-arenobufagin complex and the detailed binding mode were shown by computational molecular docking.
(A) The molecular structure of Na, K-ATPase α1β1γ E2P and the binding site of arenobufagin in the Na, K-ATPase α1β1γ E2P. (B) The molecular structure of arenobufagin. (C) The binding site of arenobufagin visualized from alpha M2 and M4. (D) The binding site of arenobufagin visualized from the top of alpha M1-6 and the interaction of arenobufagin and the residues of alpha M1-6. Hydrogen bonds were displayed as green dashed lines and amino acid residues interacted with arenobufagin were also shown.

