
Figure 3.
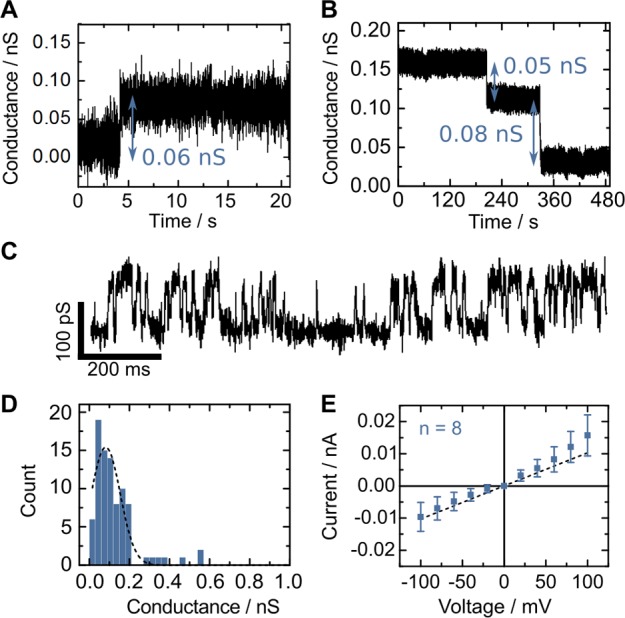
Ionic current recordings of the porphyrin-tagged duplex in 1 M KCl, 10 mM MES, pH 6.0. Exemplary current traces showing (A) an insertion at 50 mV, (B) two consequtive closure steps at 50 mV, and (C) gating behavior at 100 mV. (D) Histogram of conductance steps obtained from current traces of the duplex. The dashed line represents a Gaussian fit which peaks at 80 pS. (E) Current–voltage characteristics of stable insertions of the duplex. Error bars correspond to the standard deviation of 8 independent recordings. The dashed line represents a linear fit.