Figure 2.
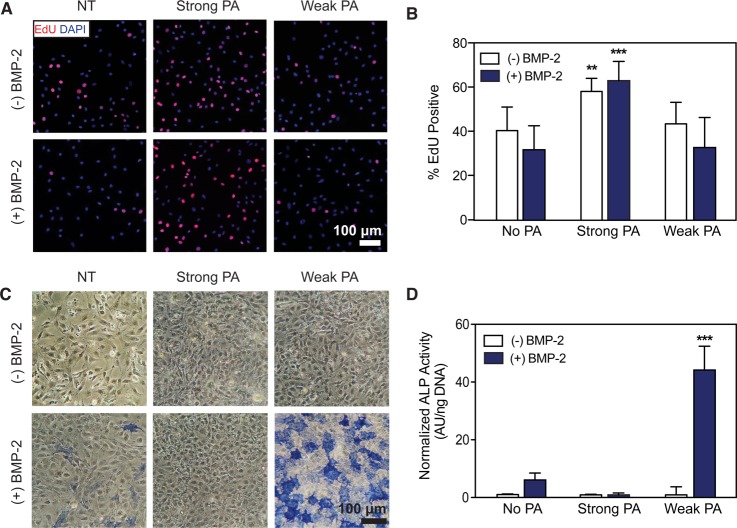
Proliferation and differentiation of C2C12 myoblast cells treated with strong or weak β-sheet PA nanofibers with and without BMP-2. (A) Representative images following an 8 h treatment with EdU to label nuclei of proliferating cells. Co-localization of EdU incorporation (red) with cell nuclei (blue) show differences in cell proliferation. Untreated control (NT). Scale bar: 100 μm. (B) Quantification of EdU positive cells (from panel A) demonstrating significant differences in cell proliferation. Kruskal–Wallis test. **p < 0.01, ***p < 0.001, compared to NT (n = 3). (C) Fast Blue staining to visualize alkaline phosphatase (ALP) activity after 3 days of culture. Scale bar: 100 μm. (D) Quantification of ALP activity following 3 days of culture using a colorimetric enzyme assay. Kruskal–Wallis test. ***p < 0.001, compared to NT (n = 4).

