
Figure 6.
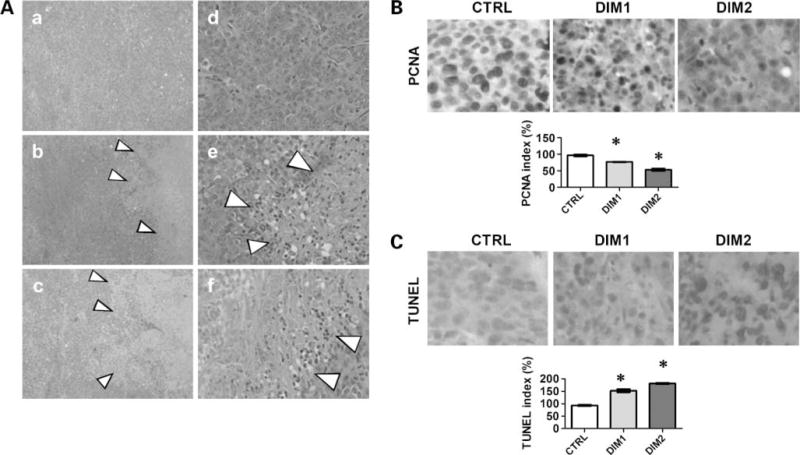
Histopathologic changes of mice tumor after DIM-C-pPhCl treatment. A, H&E staining of tumor from DMSO control [original magnification, ×40 (a) and ×200 (d)], 12.5 mg/kg/d DIM-C-pPhCl [original magnification, ×40 (b) and ×200 (e)], and 25 mg/kg/d DIM-C-pPhCl [original magnification, ×40 (c) and ×200 (f)]. Grouping was determined as described in Materials and Methods. B, PCNA staining of DMSO control (original magnification, ×200), 12.5 mg/kg/d DIM-C-pPhCl (original magnification, ×200), and 25 mg/kg/d DIM-C-pPhCl (original magnification, ×200). Grouping were determined as described in Materials and Methods. Proliferation was determined using PCNA index. CTRL, control; DIM1, 12.5 mg/kg/d DIM-C-pPhCl; DIM2, 25 mg/kg/d DIM-C-pPhCl. To calculate PCNA index, the tissue was photographed using Optotronics Tec 470 camera linked to a computer and digital printer. The intensity of the immunostaining was quantified in multiple points in five different areas of each sample by an image analyzer using Optimas image analysis software (Media Cybernetics) to obtain an average measurement. The density of proliferative cells was expressed as an average of the five highest densities identified within a single ×200 field. *, P < 0.05. C, TUNEL staining of DMSO control (original magnification, ×200), 12.5 mg/kg/d DIM-C-pPhCl (original magnification, ×200), and 25 mg/kg/d DIM-C-pPhCl (original magnification, ×200). Grouping were determined as described in Materials and Methods. Apoptosis of bladder tumors was quantified for TUNEL expression. *, P < 0.05.