Figure 2.
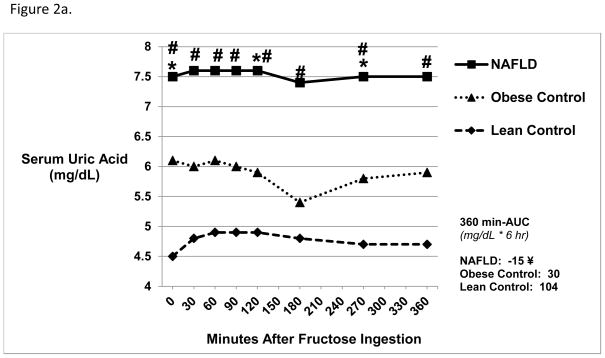
Figure 2a. Serum Uric Acid Levels 6 Hours Post-Oral Fructose Ingestion.
NAFLD subjects had higher baseline mean serum uric acid levels compared with both Obese Control and Lean Control subjects (p<0.05). NAFLD subjects had higher uric acid levels at 120 and 270 minutes post-oral fructose ingestion compared with Obese Control* subjects (p<0.05) and at all time points compared with Lean Control subjects # (p<0.05). NAFLD patients (¥) had lower AUC compared with Lean Control subjects (360 min-AUC, −15 ± 83 vs. 104 ± 73 mg/dL*6 hr, p=0.01).
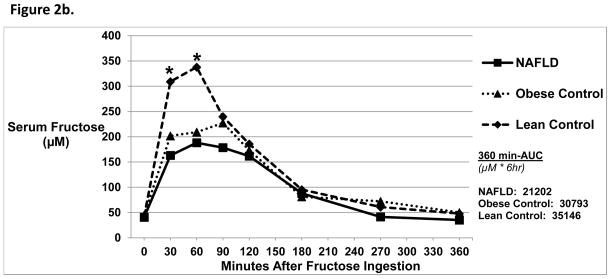
Figure 2b. Serum Fructose Levels 6 Hours Post-Oral Fructose Ingestion.
There were no differences in baseline mean serum fructose levels amongst the three groups. At 30 and 60 minutes post-oral fructose ingestion, NAFLD subjects had a lower serum fructose level compared with Lean Control subjects* (p<0.02). There were no differences amongst the three groups in 360-min AUC.
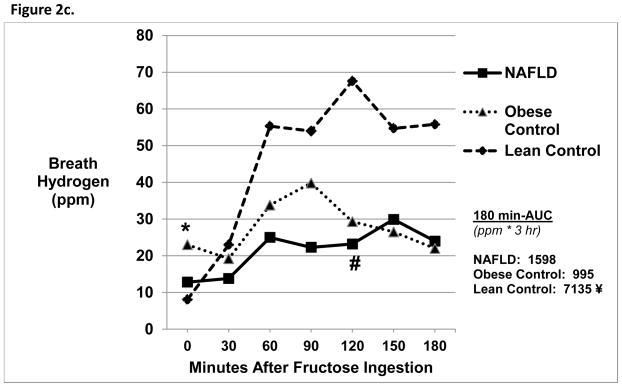
Figure 2c. Breath Hydrogen Levels 3 Hours Post-Oral Fructose Ingestion.
Obese Controls* had increased baseline breath hydrogen levels compared with Lean Controls (p=0.03). NAFLD subjects had a lower breath hydrogen concentration at 120 minutes post-oral fructose ingestion compared with Lean Control subjects # (p=0.01). Lean Control subjects (¥) had higher 180-min AUC compared with both NAFLD (7135 ± 7425 vs. 1598 ± 4203 ppm*3hr, p =0.04) and Obese Control subjects (7135 ± 7425 vs. 995 ± 2802 ppm*3hr, p=0.04).


