
FIGURE 1.
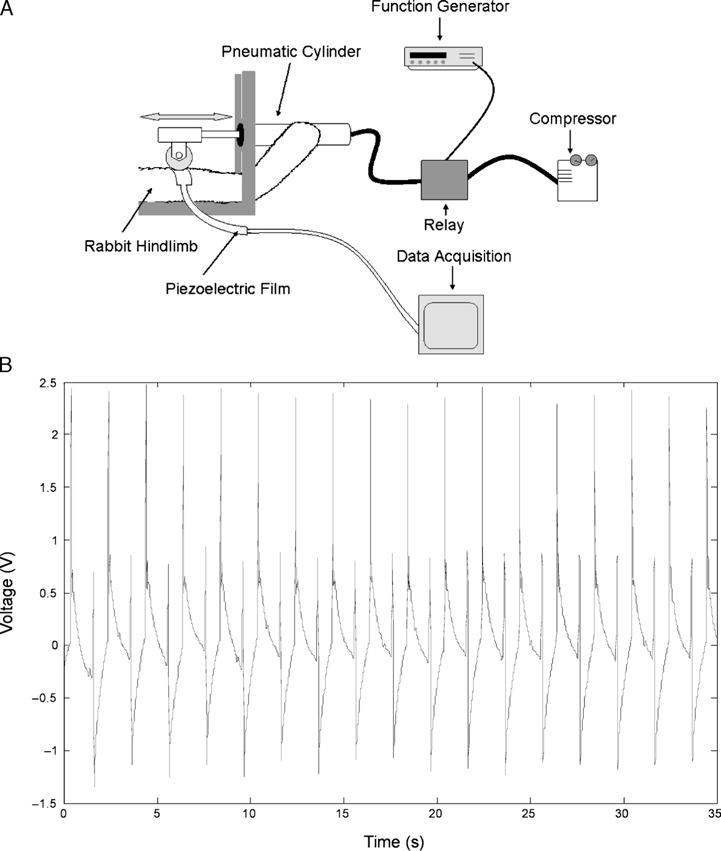
A. Schematic representation of rabbit TA receiving cyclic compressions with the computer-driven device. A closed loop system operates through both distance (position) and pressure feedback sensors. Tissue responses during compression are quantified in real time with a series of piezoelectric thin film sensors applied to the muscle’s surface. B. Voltage output versus time. Data are band pass-filtered in Matlab. Muscle compressions were performed at a frequency of 0.5 Hz. Note the reasonable consistency of measured voltage for both magnitudes from cycle to cycle. In this particular case, the calculated average normal force was approximately 11.4 N. Note that the primary peak is approximately 11.4 N, the secondary is approximately 6 N. The difference is believed to be due to bending of the film.