
. 2016 Apr 22;22(8):1961–1970. doi: 10.1097/MIB.0000000000000796
Copyright © 2016 Crohn's & Colitis Foundation of America, Inc.
This is an open access article distributed under the terms of the Creative Commons Attribution-NonCommercial-NoDerivatives License 4.0 (CC BY-NC-ND), which permits downloading and sharing the work provided it is properly cited. The work cannot be changed in any way or used commercially.
FIGURE 1.
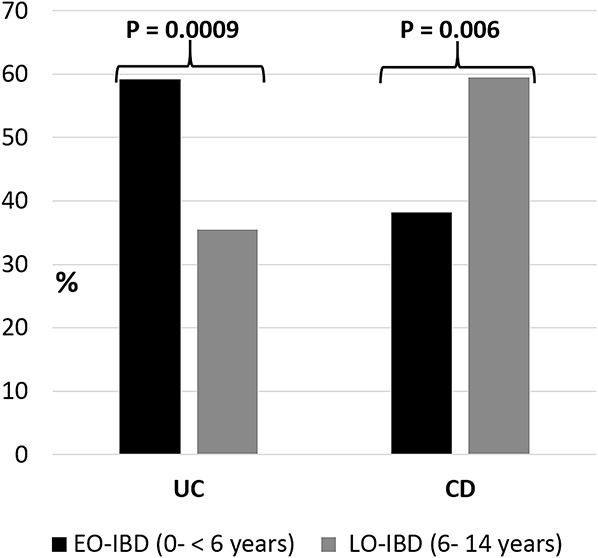
Distribution of UC and CD cases based on the age of onset.