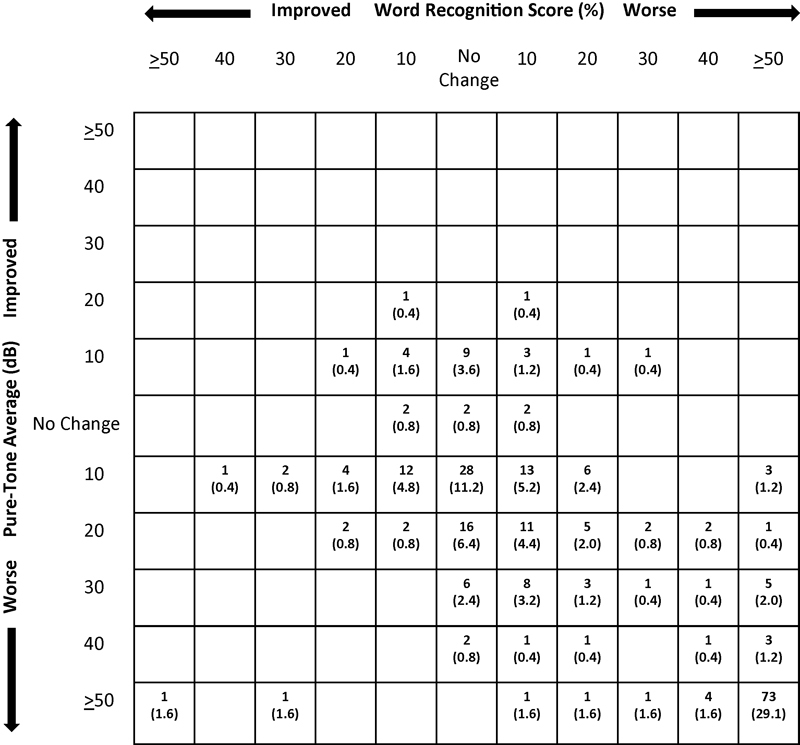
Fig. 3.

Postoperative scattergram showing the distribution of change in hearing from preoperative to last available follow-up for the middle fossa patients. The number (%) of patients who had a decrease in hearing in WRS, PTA, or both is represented in the boxes of the right lower quadrant. PTA, pure-tone average; WRS, word recognition score.
