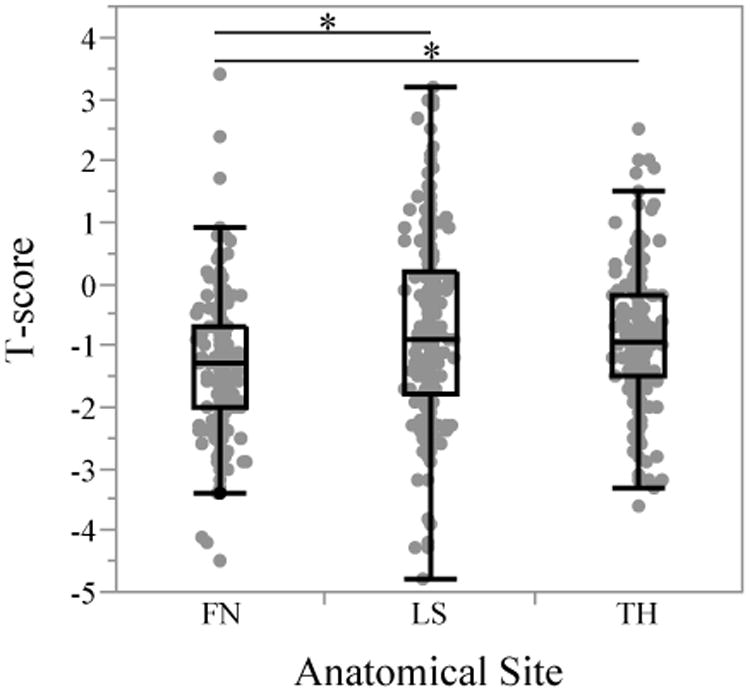
Figure 1. Distribution of Bone Mineral Density (T-Scores) at Each Anatomical Site.

T-scores at the femoral neck were significantly lower than both lumbar spine and total hip T-scores (p<0.0001 for both; indicated by asterisk) whereas lumbar spine and total hip T-scores were not statistically different from each other (p=0.55). Abbreviations: FN–femoral neck, LS–lumbar spine, TH–total hip
