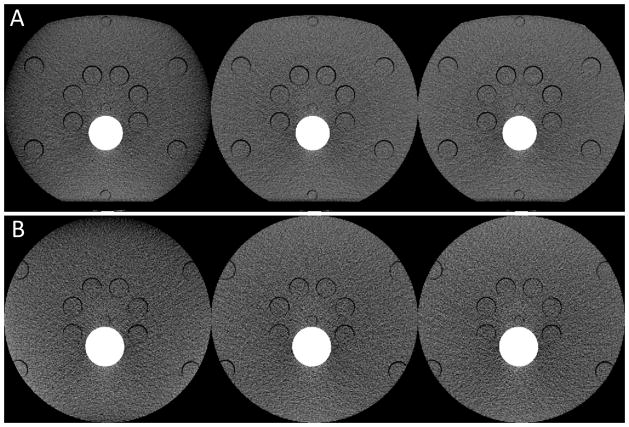
Figure 6.
PCD images of the medium (A) and large (B) CIRS abdomen phantoms obtained from 140 kV scans. These PCD images were generated using the macro mode with an energy range of [25, 140] keV. Display: W/L = 300/40 HU. Left to right: PCD images reconstructed without using any DCS (baseline images), using a DCS with the minimum effective mAs (test images), and using a DCS with the maximum effective mAs (reference images). The test images corresponding to the minimum effective mAs achieved substantial reduction of truncation artifacts and had comparable appearance as the reference images.

